How to Read a Candlestick Chart: A Beginner's Guide
You open a crypto chart, and the screen looks busy straight away. Red candles, green candles, thin lines sticking out of them, numbers moving fast, and a feeling that everyone else somehow understands it except you.
That feeling is normal.
Most beginners don't struggle because candlestick charts are too complex. They struggle because nobody explains the chart like a language. Once you learn what each candle is saying, the screen stops looking random. You start to see pressure, hesitation, strength, and weakness. If you want a broader beginner-friendly walkthrough after this, this guide on reading cryptocurrency charts for beginners is a useful companion.
A candlestick chart is popular for a simple reason. It gives you more than a single line. Each candle shows the small fight between buyers and sellers during one time interval. That could be a minute, an hour, or a day. If you've ever found it easier to understand a well-designed chart than a dense spreadsheet, the same idea applies here. Good visual thinking matters, and these effective data visualization tips help explain why clear visuals lead to better decisions.
Your First Look at a Crypto Chart
The first time a Bitcoin or Ethereum chart is loaded, it's common to stare at it for a while and then start clicking indicators. That's usually backwards. Before adding tools, you need to know what the candles themselves already tell you.
Think of the chart as a sequence of tiny stories. One candle might show buyers taking control. The next might show sellers pushing back. A few candles together can show confidence, panic, or indecision.
Why traders prefer candles
Candlestick charts are used widely because they show more information in a compact form than a simple line chart. You're not just seeing where price ended. You're seeing how price moved during that period.
That matters in crypto because markets move quickly. A candle can show a strong rally, a failed breakout, or a sharp rejection in just one shape.
Most chart confusion disappears when you stop asking, “What pattern is this?” and start asking, “Who pushed price, and who pushed back?”
A beginner often sees colour first. A more experienced trader sees behaviour first. Green doesn't automatically mean “buy”. Red doesn't automatically mean “sell”. The candle only makes sense in context.
What you're really looking at
When you learn how to read a candlestick chart, you're learning to read a repeated battle:
- Buyers push upward when demand is stronger.
- Sellers push downward when supply is stronger.
- The final candle shape shows who had more control by the end of that time period.
That's why candles are useful. They don't predict the future by themselves, but they show the behaviour that produced the current price.
The Anatomy of a Single Candlestick
Before you can read groups of candles, you need to read one candle properly.
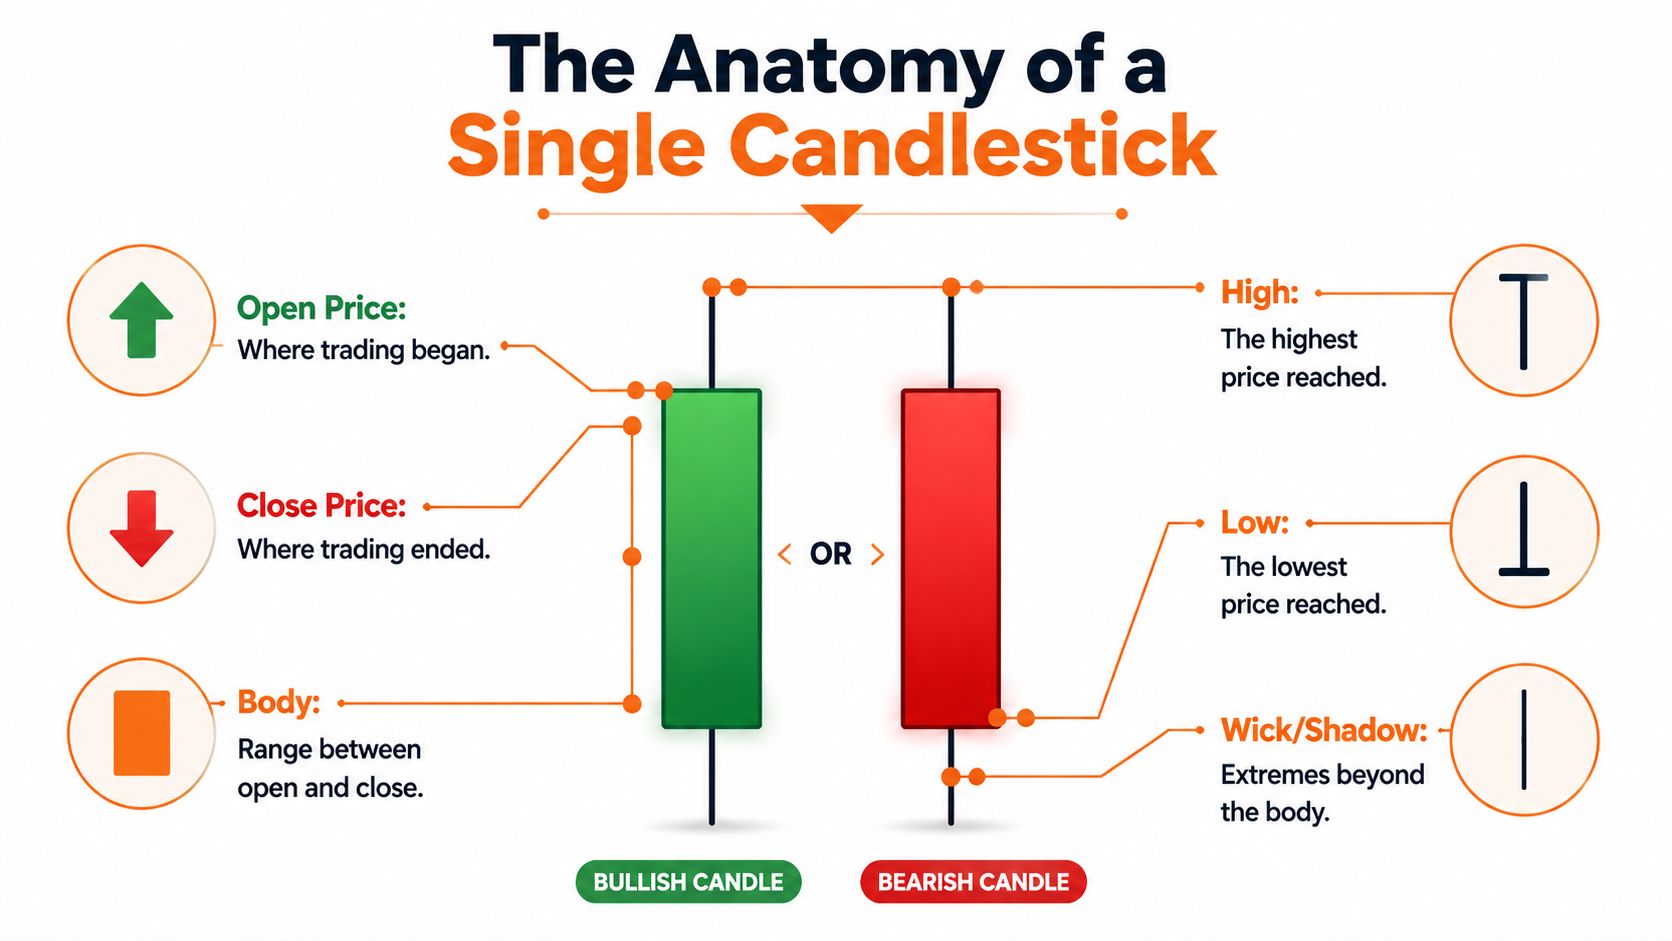
A candlestick chart encodes four precise data points for each time interval: Open, High, Low, and Close. The body is the wide rectangular part between the open and close, while the wicks extend to the high and low. A green or hollow candle means the close finished above the open, and a red or filled candle means the close finished below the open, as explained in Domo's overview of candlestick charts and OHLC structure.
The four prices that matter
Here's the cleanest way to read one candle:
| Part | What it means | Why it matters |
|---|---|---|
| Open | The price where that period began | Shows the starting point of the battle |
| High | The highest price reached | Shows how far buyers managed to push |
| Low | The lowest price reached | Shows how far sellers managed to push |
| Close | The price where that period ended | Shows who had more control at the finish |
If you're looking at a 5-minute candle, those four points happened within 5 minutes. If you're looking at a 1-day candle, they happened across a full day.
Body and wick in plain English
The body is the main block of the candle. It shows the distance between the open and the close.
The wick, also called the shadow, shows where price travelled beyond the body before pulling back. A long wick tells you price reached an extreme but didn't stay there.
Envision a tug-of-war. The body shows where the rope started and where it ended. The wick shows how far one side briefly dragged it before losing some ground.
- Long body: Stronger conviction during that period.
- Short body: Less progress, more hesitation, or balanced pressure.
- Long upper wick: Buyers pushed higher, but sellers forced price back down.
- Long lower wick: Sellers pushed lower, but buyers stepped in and lifted price back up.
Practical rule: Don't just look at candle colour. Look at where the candle travelled and where it finally closed.
Bullish and bearish candles
A green candle is often called bullish because the close is above the open. A red candle is bearish because the close is below the open.
That sounds simple, but the shape changes the meaning. A small green candle after a strong rally doesn't carry the same message as a large green candle after a sell-off. One may show weak follow-through. The other may show strong recovery.
A helpful way to read any single candle is to ask:
- Where did the candle open?
- How far did buyers and sellers stretch it?
- Where did it close relative to the full range?
Those three questions keep you grounded in real price action instead of guessing.
Recognising Common Candlestick Patterns
One candle is a sentence. A few candles together become a conversation.
If you want a deeper library of setups after this, this guide on understanding candlestick patterns for crypto trading is worth keeping open in another tab.
The Doji and the Hammer
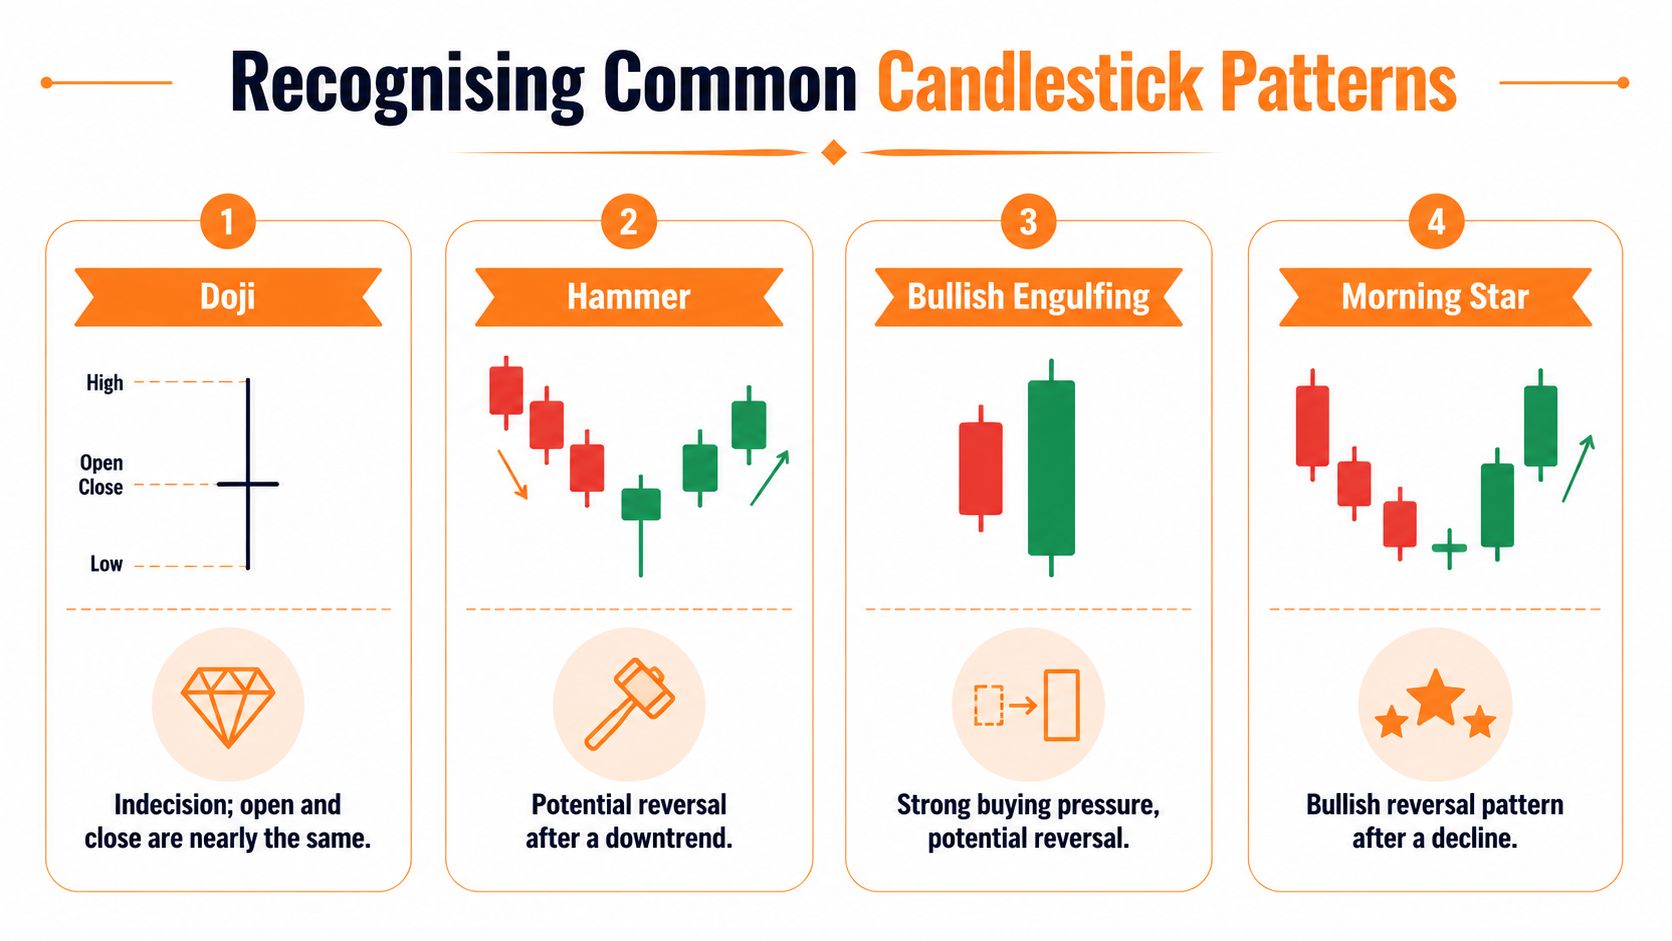
A Doji forms when the open and close are very close. The candle body is tiny, and the chart is telling you one thing clearly: indecision.
That doesn't mean a reversal is guaranteed. It means the market paused. Buyers and sellers ended the period in near balance.
A Hammer usually appears after a decline. It has a small body near the top and a longer lower wick. The shape tells a story. Sellers pushed price down, but buyers stepped in strongly enough to drag the close back up near the opening area.
On a live Bitcoin chart, that can look like fear early in the candle and rejection later in the same period. The lower wick matters because it shows that lower prices were tested and then refused.
Engulfing patterns and who takes control
A Bullish Engulfing pattern is a two-candle idea. First you get a bearish candle. Then you get a larger bullish candle whose body wraps around the prior body.
That matters psychologically. The first candle says sellers had control. The second says buyers didn't just respond, they overpowered the previous move.
The opposite idea applies to a Bearish Engulfing pattern. Buyers look in charge first, then sellers take over with enough force to consume the prior candle's body.
Here's a simple comparison:
| Pattern | Basic message | What to watch |
|---|---|---|
| Doji | Market indecision | Useful near key levels |
| Hammer | Rejection of lower prices | More meaningful after a decline |
| Bullish Engulfing | Buyers take control | Stronger if it appears after weakness |
| Bearish Engulfing | Sellers take control | Stronger if it appears after a rise |
A good pattern isn't strong because it has a famous name. It's strong because the shape reflects a believable shift in pressure.
The video below shows a practical way to judge candle behaviour, especially momentum and shrinking bodies:
Morning Star and the idea of transition
A Morning Star is a three-candle pattern often linked with a bullish reversal. What makes it useful is not the label. It's the transition it represents.
The first candle shows selling pressure. The second shows slowing or hesitation. The third shows buyers stepping in with more intent.
That middle pause is important. Markets often turn not in one dramatic move, but through a loss of confidence from the side that was in control.
A pattern becomes more useful when you can explain the behaviour behind it in one plain sentence.
If you can say, “Sellers pushed hard, then stalled, then buyers took over,” you're reading the chart properly.
Reading Market Trends and Momentum
A pattern on its own can mislead you. The same Hammer means something different in a falling market than in a rising one.
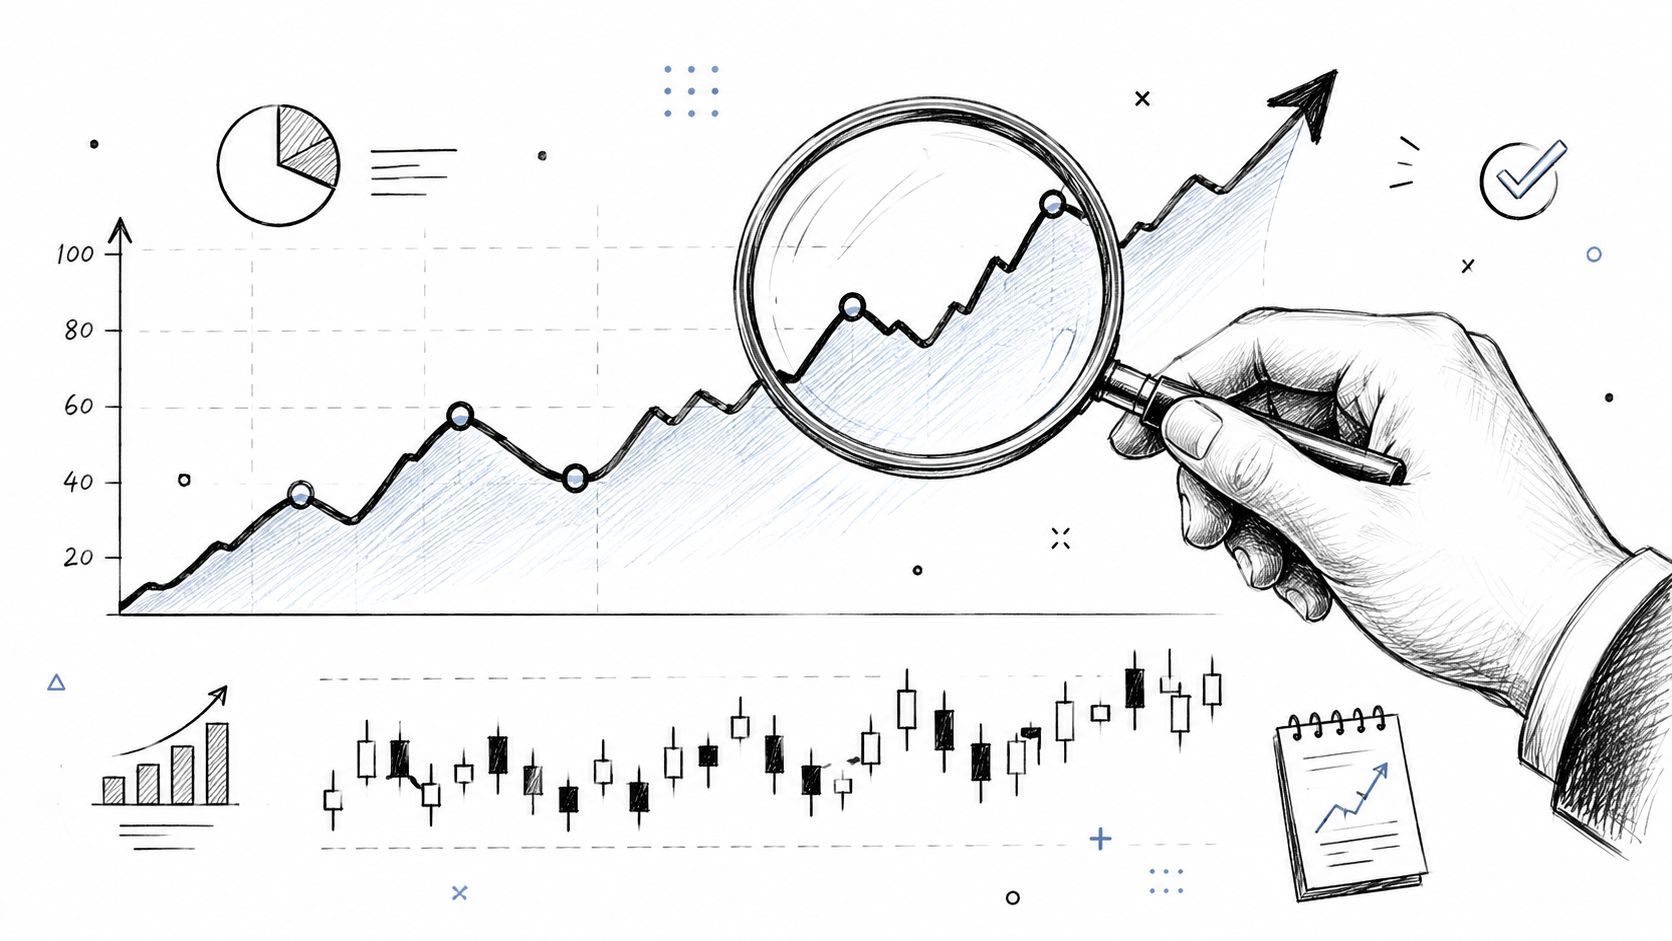
Trend reading is where beginners start to move from spotting shapes to understanding flow. For a fuller framework, this guide on mastering market trends in crypto trading expands the idea well.
How to spot trend direction
At a basic level:
- Uptrend: Price keeps making higher highs and higher lows.
- Downtrend: Price keeps making lower highs and lower lows.
- Sideways market: Price moves in a range without clear progress.
Candles help you see the strength inside that trend. In an uptrend, repeated green candles with healthy bodies often show buyers are still pushing. In a downtrend, repeated red candles show sellers remain active.
But direction is only half the job. You also need to judge whether the move still has energy.
When momentum starts fading
Momentum loss can be spotted by shrinking candle bodies during a trend. In a downtrend, if a large red candle is followed by progressively smaller red candles, the distance travelled per candle decreases. That signals selling pressure is fading and a reversal may be near, as shown in this video explanation of momentum loss through candle size.
The same logic works in reverse for an uptrend. If strong green candles begin to shrink, buyers may still be in control, but they're no longer advancing with the same force.
Here's a practical reading method:
- Look at the sequence, not just the latest candle.
- Compare body size from one candle to the next.
- Notice failed pushes, especially when new candles make less progress.
Smaller bodies in the same direction often mean pressure is weakening, not strengthening.
That doesn't mean price must reverse immediately. It means you should stop assuming the existing move is as strong as it was a few candles ago.
Avoiding Common Pitfalls and Using Confirmation
Many beginners lose money by spotting a pattern, feeling excited, and entering before checking whether the signal is supported.
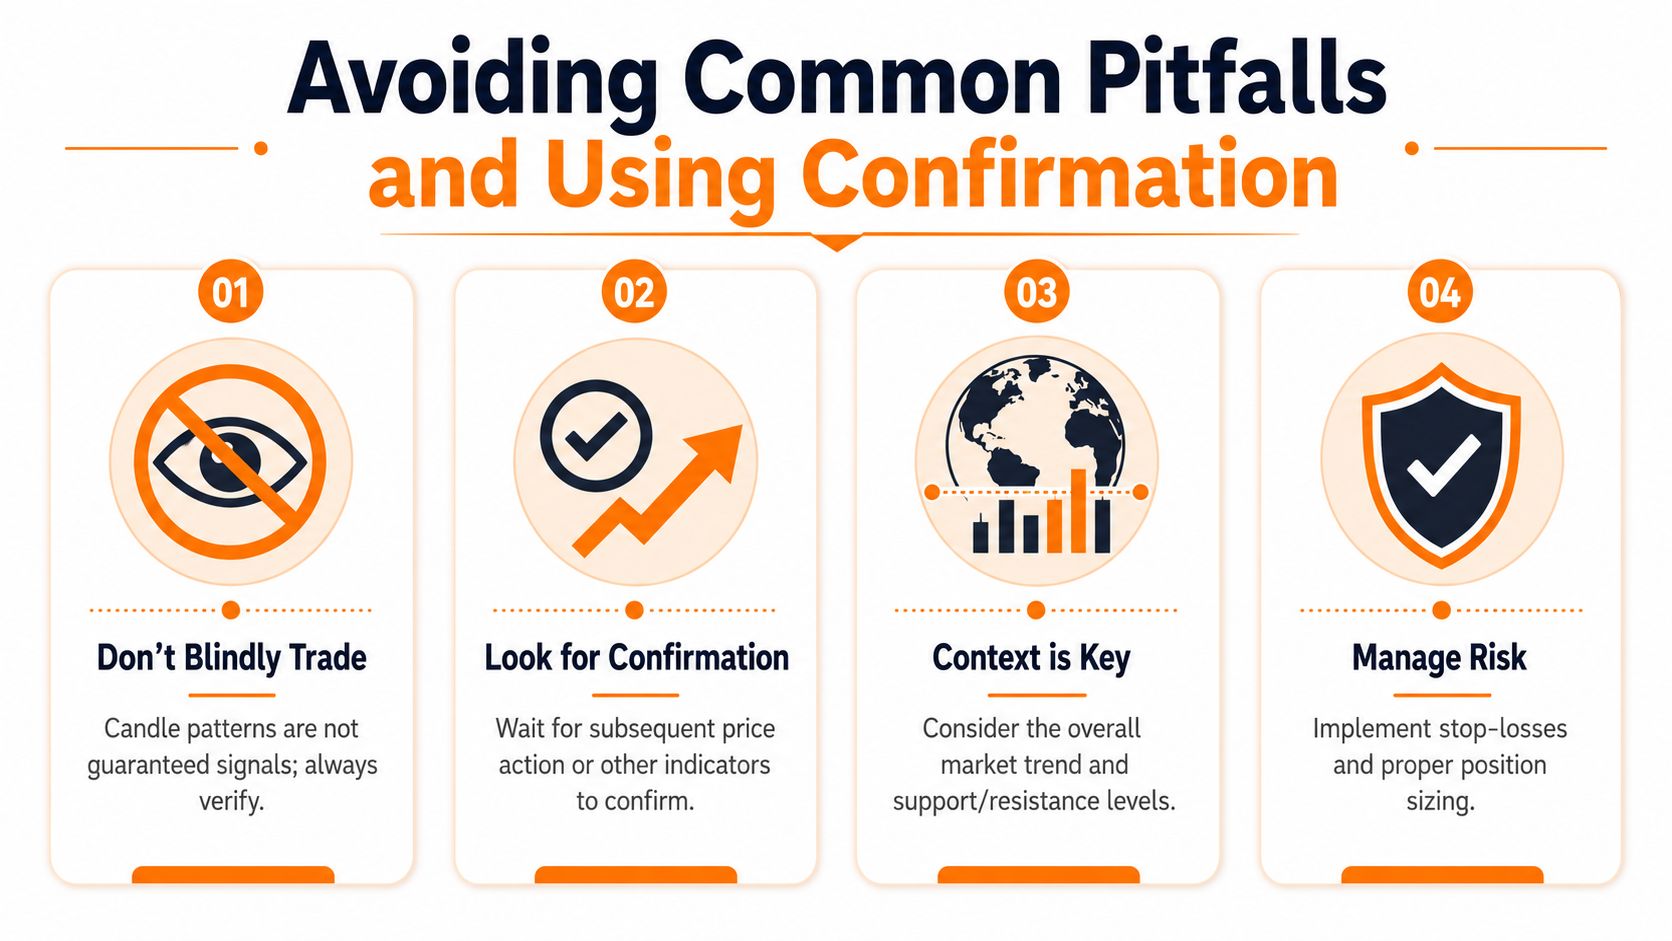
A candle pattern is not a promise. It's a clue. You still need confirmation.
Why volume matters
A pattern with weak participation can fail quickly. Volume helps you judge whether traders are backing the move.
Recent FCA warnings highlighted that 55% of UK retail traders fail to check volume before entering trades, and data from IG International showed that 72% of false signals in UK retail trading occur when volume is not considered alongside price patterns, as discussed in this video covering volume confirmation and false signals.
That matters more than most beginner tutorials admit.
- Strong-looking candle, weak volume: The move may lack conviction.
- Modest candle, strong volume: The move may have more support than it first appears.
- Pattern at a key level with volume backing it: Often more worth your attention.
The timeframe illusion
One of the easiest mistakes is reacting to a candle before it closes.
A candle that looks bullish halfway through its life can finish bearish. A wick can grow, disappear, or reverse before the period ends. This is especially tricky in crypto because charts move around the clock, and a still-forming candle can tempt you into acting on incomplete information.
That's the timeframe illusion. You think you're reading a finished message, but you're really reading a draft.
A better checklist before acting
Instead of pattern hunting, use a short filter:
- Wait for the close: A nearly perfect setup can change in the final part of the candle.
- Check volume: Price shape without participation can be misleading.
- Read context: A bullish pattern into major resistance isn't the same as one after a washout.
- Define risk first: Decide where the idea is invalid before you click buy or sell.
Good trading often means passing on trades that look exciting but lack confirmation.
That mindset feels boring at first. It's also one of the habits that keeps beginners in the game long enough to improve.
Putting It All Together with a Trading Example
Say you're looking at an Ethereum chart after a steady drop. You notice selling has been strong, but the most recent red candles are getting smaller. That suggests the down move may be losing force.
Then a Hammer forms near an area where price had previously bounced. You don't buy immediately. First, you wait for the candle to close. Then you check whether the next candle supports the idea instead of cancelling it. You also look at volume. If the bounce appears with stronger participation, the setup becomes more believable.
Your thought process might look like this:
- Trend context: Price had been falling.
- Momentum read: The sell-off started to lose force.
- Pattern: A Hammer suggests rejection of lower prices.
- Confirmation: The next candle and volume support the shift.
- Risk plan: You place your invalidation below the rejection area, not based on hope.
That's how to read a candlestick chart in practice. Not as magic. Not as a collection of names to memorise. As a way to read pressure, context, and conviction with patience.
If you want to build these skills properly, The Coin Course is a solid place to continue. It offers clear crypto education for beginners and active traders, with practical guides on charts, trading, risk, blockchain basics, wallets, security, and wider market concepts so you can keep learning without relying on hype.