When you see a specific group of candlesticks on a trading chart, you might be looking at a reversal pattern. Simply put, these patterns are visual hints that the current price trend is losing its energy and could be about to switch directions.
For a trader, these signals are like gold. They can suggest that a downtrend is about to turn into an uptrend (or the other way around), giving you a valuable clue about when it might be a good time to buy or sell.
Learning to Read the Market's Story
Think of a trading chart as a story being told, where each candlestick is a scene in the constant battle between buyers (bulls) and sellers (bears). A candlestick reversal pattern is like a major plot twist in that story—a powerful visual signal that the momentum is about to change.
These patterns are not crystal balls; they can't promise a specific outcome. What they do is offer a peek into how the market is feeling. For example, a long wick at the bottom of a candle after a big price drop tells an interesting story: sellers tried to force the price down, but buyers rushed in, buying up the asset and pushing the price back up. This is a classic sign that the balance of power might be shifting.
Why These Signals Are So Important to Traders
Being able to spot these patterns is a key part of technical analysis, which is all about using past price movements to guess what might happen next. If you want to learn more, our guide on technical analysis in crypto markets is a great place to start.
By recognizing these shapes, traders can get a real advantage:
- They can get ahead of possible trend changes before everyone else notices.
- They can spot good moments to think about opening a new trade.
- They can see the first signs of weakness in a current trend, which might mean it’s time to take profits.
A candlestick pattern is a powerful way to see the story of supply and demand in a specific timeframe, making complicated market feelings easier to understand.
Ultimately, these patterns help you listen to what the market is saying. In this guide, we'll go through the most dependable and important candlestick reversal patterns, using clear, real-world examples. We'll break down what each pattern means, where to find it, and how you can use it to build a smarter trading strategy.
Spotting Powerful Bullish Reversal Patterns
Every trader dreams of catching a trend just as it's turning. When a crypto asset like Bitcoin is stuck in a downtrend, knowing what to look for can be the difference between buying at the bottom and getting stuck in a falling market. This is where bullish reversal patterns come in—they're the flickers of light that signal the tide might be turning.
Let's look at three of the most classic patterns you'll see on a chart, which act as clues that the sellers are losing their grip and the buyers are getting ready to take over.
This chart shows the thought process perfectly. You're not just looking at a pattern by itself; you're seeing it as a potential challenge to the existing trend.
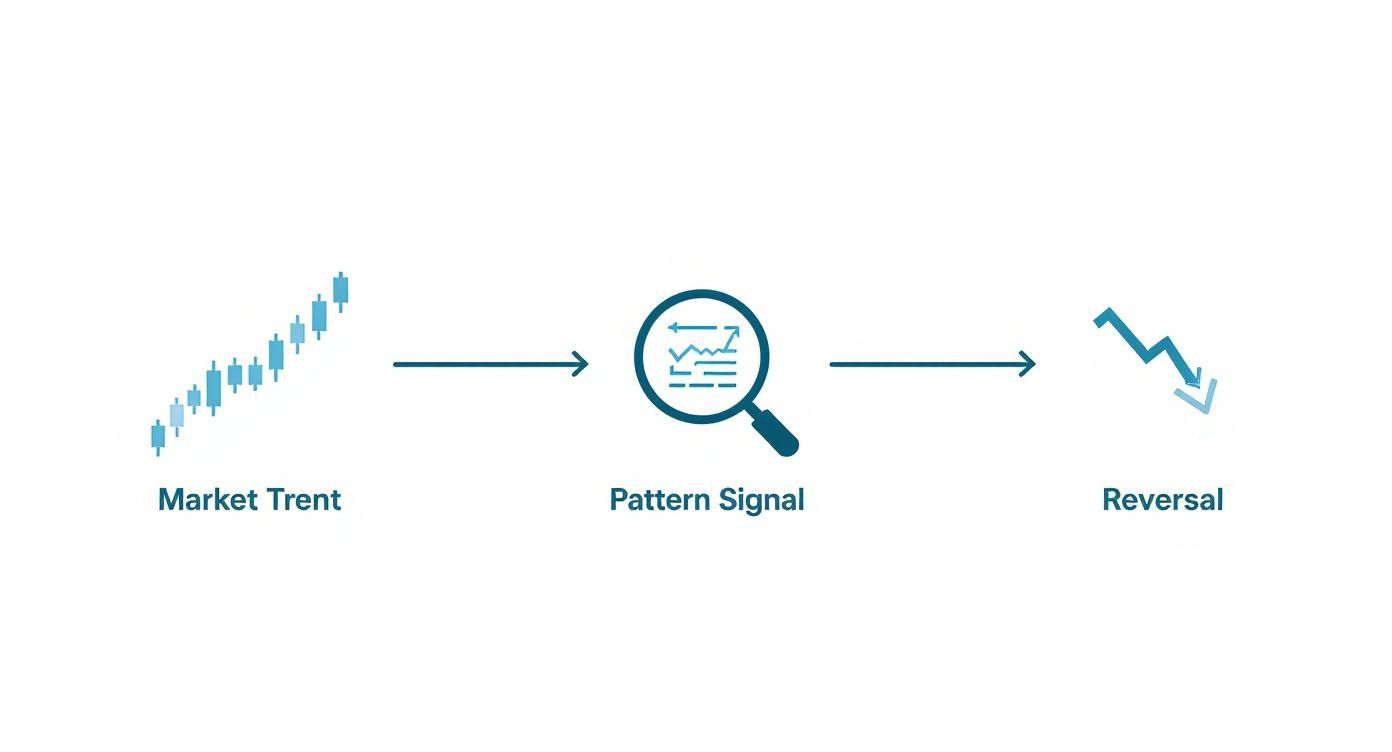
As the infographic shows, a reversal pattern isn't just a random shape—it's a story playing out on the chart, where a new signal appears to fight the current market direction.
The Hammer: A Sign of Buyer Strength
The Hammer is likely one of the first patterns most traders learn, and for good reason. It’s a single candlestick that often shows up at the low point of a downtrend, looking just like its name suggests: a small body at the top with a long lower wick. As a rule, that wick should be at least twice as long as the body.
Picture the Hammer as a story told in one trading session. The sellers first pushed the price way down, creating that long, scary-looking wick. But then, the buyers charged in. They fought back hard, pushing the price all the way back up to close near where it opened.
This dramatic rebound is a strong rejection of lower prices. It’s a clear signal that the sellers tried their best and failed, and now the buyers are stepping up to take control.
The Inverted Hammer: A Hint of a Comeback
The Inverted Hammer is the Hammer’s upside-down twin. You'll also spot this one at the bottom of a downtrend, signaling a possible bullish turnaround. It has a small body at the bottom, a long upper wick, and almost no lower wick.
Its story is a bit different but just as meaningful. Here, the long upper wick shows that buyers made a brave attempt to push the price higher during the session. Even though sellers managed to drag it back down by the end, that first burst of buying pressure is the real clue. It suggests buyers are testing the waters, and the downward push is starting to weaken.
A candlestick pattern is just a hint, not an order. The most successful traders always look for confirmation before acting on a signal.
This is a vital point. Never trade a pattern the moment you see it. With a Hammer or Inverted Hammer, you should wait for the next candle to confirm your idea. If the following candle is green and closes above the high of the Hammer, it supports the reversal signal, making it a much safer trade.
The Bullish Engulfing Pattern: A Clear Power Shift
If the Hammer is a hint, the Bullish Engulfing pattern is a shout. This is a two-candle formation that sends one of the strongest bullish reversal signals you can find. It starts with a small red (bearish) candle, which is then completely "swallowed" by a much larger green (bullish) candle.
The story here happens over two sessions. On day one, sellers are still in charge, pushing the price down. But on day two, everything flips. The price might open a bit lower, but then the buyers take over with huge force, driving the price up so high that it closes well above the previous day's open. For instance, if Ethereum's price drops to $2,950 with a small red candle one day, a Bullish Engulfing happens if the next day it opens at $2,940 and then rockets up to close at $3,100, completely covering the previous day's candle.
This isn’t just a small win for the buyers; it’s a total takeover. They’ve managed to completely reverse the market feeling in one go. This specific candlestick pattern has been studied a lot. Historical analysis shows the Bullish Engulfing pattern can have a success rate between 65% and 79%, especially when it’s supported by a big jump in trading volume. You can find more insights about candlestick reliability on financial education sites.
To help you keep these patterns straight, here's a quick reference table.
Key Bullish Reversal Patterns at a Glance
| Pattern Name | Appearance | What It Signals |
|---|---|---|
| Hammer | Small body at the top, long lower wick (at least 2x the body), found in a downtrend. | Sellers pushed the price down, but buyers rejected the low and pushed it back up, indicating strong buying pressure. |
| Inverted Hammer | Small body at the bottom, long upper wick, little to no lower wick, found in a downtrend. | Buyers tested higher prices but met resistance. It shows that buying interest is returning and selling pressure is weakening. |
| Bullish Engulfing | A small red candle followed by a large green candle whose body completely covers the previous red candle's body. | A huge shift in momentum where buyers have completely overpowered sellers in a single session. |
This table gives a quick summary of what to look for, but remember that the situation is everything. Always look at the bigger trend and wait for confirmation before making a move.
Spotting the Top: Key Bearish Reversal Patterns
Where bullish patterns tell us buyers are taking charge, bearish reversal patterns are the storm clouds gathering on the horizon of an uptrend. They're the early warnings that the buying energy is running out. If you learn to read these signs, you'll know when it might be smart to secure profits or even get ready for a potential drop. These patterns tell the story of sellers fighting to take back control from the buyers.
Getting good at spotting these signals at the top of a trend is a game-changer. Let's break down three of the most reliable bearish candlestick patterns that act as a warning sign, hinting that the market feeling is shifting from greed to fear.
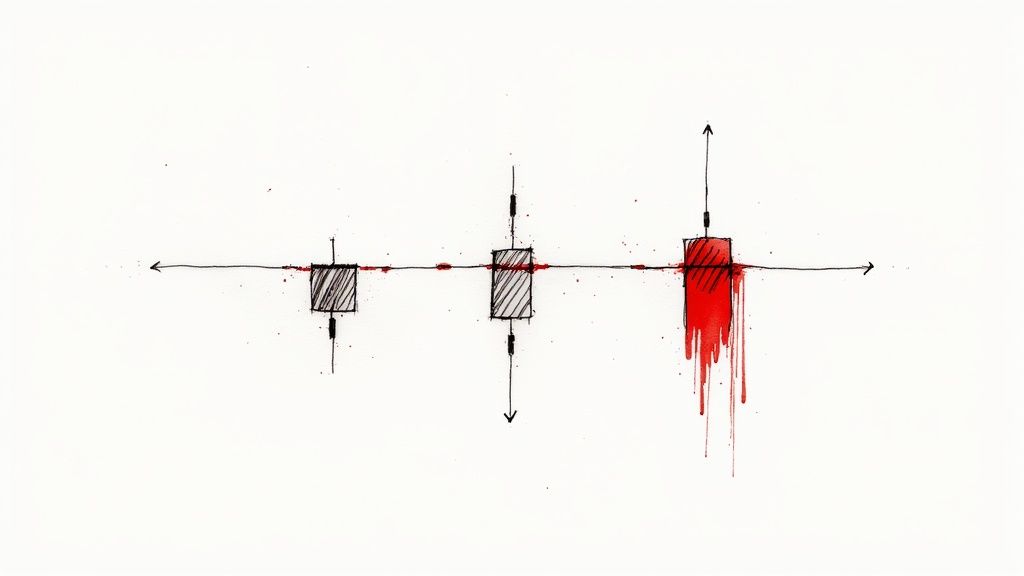
The chart above shows a classic example of a bearish signal appearing after a good price increase. Think of it as a visual hint that the upward climb is hitting a wall.
The Shooting Star: A Failed Push
The Shooting Star is a classic sign of trouble that forms at the top of an uptrend. It’s pretty easy to spot: a small body sits at the bottom of the candle, with a long upper wick reaching up at least twice the height of the body. It’s basically an upside-down Hammer.
So, what’s the story here? It’s a story of rejection. During the session, the buyers were feeling confident, pushing the price way up—that’s what creates the long wick. But their victory was short-lived. Sellers jumped in with enough force to slam the price right back down, making it close near where it opened.
This failure to stay at higher prices is a huge red flag. It suggests the buyers are running out of energy and the sellers are starting to take over.
The Hanging Man: A Crack in the Foundation
At first glance, the Hanging Man looks exactly like a Hammer. The key difference isn't its shape, but where you find it. While a Hammer is a bullish sign at the bottom of a downtrend, the Hanging Man is its bearish twin, showing up at the top of an uptrend.
It has a small body at the top with a long lower wick hanging below. This shows that at some point during the session, sellers managed a big push downwards. Even though the buyers fought back to bring the price up by the end, that deep, first sell-off is a serious warning.
A Hanging Man suggests that selling pressure is quietly growing within an uptrend, even if buyers manage to hide the cracks for a while. It’s a sign that the trend's foundation is becoming shaky.
It's like seeing the first crack in a dam. It hasn't burst yet, but the pressure is building, and a break might not be far away.
The Bearish Engulfing Pattern: A Decisive Takedown
The Bearish Engulfing pattern is one of the most direct and powerful bearish signals you’ll ever see on a chart. It’s a two-candle pattern. It starts with a small green (bullish) candle, which is then completely swallowed up, or "engulfed," by a much larger red (bearish) candle.
This pattern shows a sudden and harsh shift in power. The first small green candle shows the uptrend is still going. But the very next session is a total disaster for buyers. Sellers come in with so much force that they don't just erase the previous day's gains; they push the price well below its opening price. This isn't just a reversal; it's a statement that sellers have taken complete control.
And it’s not just theory. Studies looking at markets like the UK stock indices have shown these patterns have real predictive power. The Bearish Engulfing pattern, for example, has demonstrated success rates between 65% and 79% in certain conditions. You can discover more insights about trading bearish patterns from more detailed market analysis.
But remember, with any candlestick signal, confirmation is your best friend. Always wait to see if the next candle also closes lower to support the pattern before you even think about making a trade.
How to Read Multi-Candle Reversal Formations
While a single candle gives you a quick snapshot, multi-candle patterns tell a much richer story. Think of it like this: a single candle is a word, but a multi-candle pattern is a full sentence. These formations, built from two or three candles, give you a more complete story of a potential trend change, making them some of the most reliable signals out there.
These patterns paint a clear picture of the power struggle between buyers and sellers. By watching how the candles interact over a few sessions, you can spot a confirmed shift in momentum with much greater confidence. Let's look into some of the most important ones.
The Morning Star: A Bullish Dawn
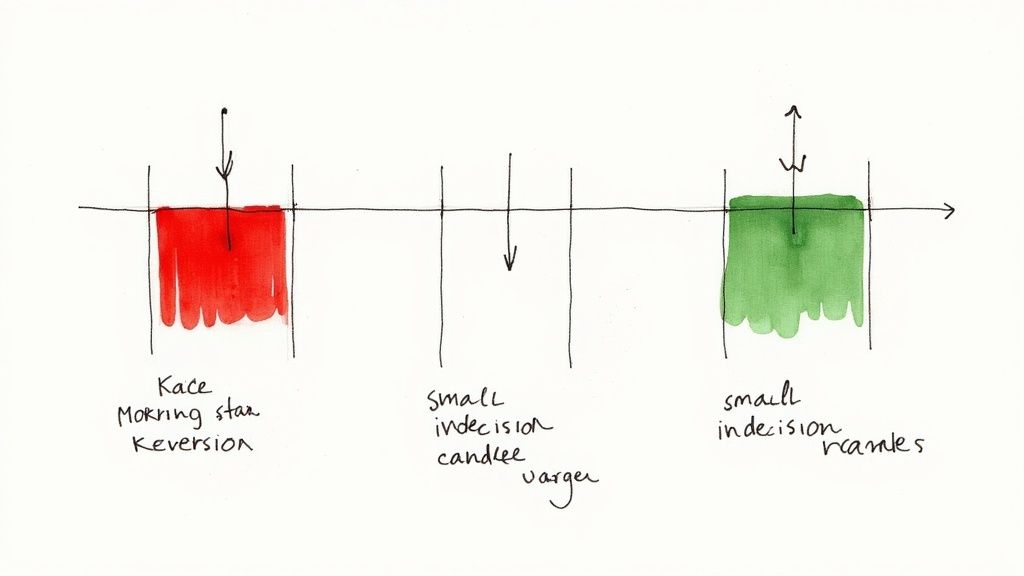
The Morning Star is a classic three-candle bullish reversal pattern. You'll usually find it at the bottom of a downtrend, and it often signals that the worst is over for sellers and a new uptrend is about to begin.
Here’s how the story plays out across the three candles:
- The Dominant Seller: The pattern starts with a long, angry-looking red candle. This shows sellers are still in control, pushing the price down with confidence.
- The Moment of Indecision: Next, a small candle appears—often a Doji or a spinning top. It can be red or green, but its tiny body is the key. It tells you the selling pressure is running out of gas. Neither side has the upper hand.
- The Buyer's Takeover: The third candle is a big, powerful green one. Importantly, it must close at least halfway up the body of that first red candle. This confirms that buyers have taken back control and are now driving the price up with force.
The Evening Star: A Bearish Sunset
As you might guess, the Evening Star is the bearish twin of the Morning Star. It shows up at the top of an uptrend and serves as a strong warning that the party might be over for the buyers. It’s a clear signal to think about taking some profit.
This pattern also tells a three-part story:
- The Confident Buyer: It starts with a long green candle, showing the uptrend is going strong and buyers are feeling good.
- The Stall: Just like its bullish cousin, the second candle is small and indecisive. This pause right at the top suggests the buying energy is fading.
- The Seller's Counter-Attack: The final candle is a large red one that closes well into the body of the first green candle. This confirms that sellers have rushed in, overpowering the buyers and pushing the price down.
Multi-candle patterns are so powerful because they show a clear shift of power. You're not just seeing one moment of rejection; you're watching a complete change in market feeling unfold over several trading sessions.
Tweezer Tops and Bottoms: A Test of Strength
Tweezer Tops and Tweezer Bottoms are quick two-candle patterns that signal a potential reversal. They work by showing a strong rejection at a very specific price level, almost like the market is hitting a brick wall.
A Tweezer Bottom forms during a downtrend. The first candle is red, and the second is green. The most important feature? They both have nearly identical low points. This tells you that sellers tried to push the price lower but were met with a solid floor of buyers who refused to let it fall any further.
On the other side, a Tweezer Top appears during an uptrend. Here, the first candle is green and the second is red, with both sharing almost the exact same high. This signals that buyers ran out of steam and failed to break through a price ceiling, allowing sellers to step in. These formations are essential for reading cryptocurrency charts and indicators because they clearly highlight key support and resistance areas.
A Practical Framework for Trading Reversals
Spotting a reversal pattern on a chart is a great start, but that’s really only half the job. The real skill is knowing how to trade it. So, let's move past the theory and look at a practical, five-step plan you can use to trade these signals with more confidence.
Think of these rules as your pre-trade checklist. Each step is designed to add another layer of proof, helping you ignore weaker signals and focus only on the setups with the highest chance of success. Following this process can help you avoid common mistakes, like acting too quickly on an unconfirmed pattern or ignoring what the rest of the market is doing.
The Golden Rules of Reversal Trading
First things first: context is king. A perfect-looking reversal pattern that appears in the middle of nowhere on a chart doesn't mean much. But if that same pattern forms at a major support or resistance level? Now that’s a signal you should pay attention to. These are the areas where price has historically stopped or reversed, making any pattern there much more important.
Next, you need to wait for proof. A single candlestick pattern is a clue, not an order to trade. The confirmation rule is simple: wait for the next candle to support your idea. For a bullish pattern like a Hammer, this means waiting for the following candle to close above the high of the Hammer before you even think about entering a trade.
Trading a candlestick pattern without confirmation is like guessing the end of a movie after the first scene. Wait for the plot to develop before making your move.
Adding Layers of Confidence
Third, follow the volume. A big jump in trading volume appearing with a reversal pattern is a huge vote of confidence. High volume shows real belief from other traders. It tells you that a lot of money is backing the move, which makes the reversal much more likely to last.
A great example of this was seen in UK index trading in 2023. When a Hammer candlestick formed on the FTSE 100 (UK100) index in September after a dip, it was accompanied by a huge jump in volume. This combination signalled intense buying pressure and gave traders a much stronger reason to believe a bullish reversal was about to take hold. You can read more about how these patterns reliably forecast trend reversals on UK indices.
Fourth, don't let your patterns trade alone. The best traders combine signals. Pair your candlestick analysis with technical indicators like the Relative Strength Index (RSI) or the MACD. A bullish reversal pattern becomes so much more powerful if the RSI is also signalling an "oversold" condition, suggesting the previous downtrend has run out of gas.
Protect Your Capital at All Costs
Finally, and this is the most important rule of all, always manage your risk. I don't care how perfect a setup looks—it can still fail. Before you place any trade, you must know exactly where your stop-loss and profit targets are. A common-sense approach is to place your stop-loss just below the low of a bullish pattern or just above the high of a bearish one. This ensures that if the market turns against you, your losses are kept small.
Protecting your money is the absolute foundation of long-term trading success. You can dive deeper into this crucial topic in our complete guide to risk management in cryptocurrency trading.
Got Questions About Reversal Patterns? Let's Clear Things Up
When you're new to candlestick patterns, it's normal to have a few questions. Actually, it's a good sign – it means you're thinking like a trader. Getting these basics right from the start is what separates consistently profitable traders from those who lose money.
Let's walk through some of the most common questions I hear.
How Reliable Are Candlestick Reversal Signals, Really?
This is the big question, isn't it? The honest answer is, their reliability is all about the situation. A candlestick pattern isn't a magic crystal ball; think of it more as a strong, educated guess about what might happen next.
Past data and testing show that major patterns, like the Engulfing or Hammer, can be right somewhere between 55% and 65% of the time, sometimes even more. But that's just the starting point.
Their real power is unlocked when other signals line up. A reversal pattern becomes much more trustworthy when it shows up at a major support or resistance level, especially with a big jump in trading volume. A pattern on its own is a hint, but a pattern with confirmation is a convincing argument.
The single biggest trap traders fall into is jumping the gun on a pattern without waiting for confirmation. Patience pays off here. Always wait for the next candle to confirm the reversal signal before you even think about placing a trade.
Do These Patterns Work on Any Timeframe?
Absolutely. You'll spot a candlestick reversal pattern on everything from a one-minute chart right up to a weekly one. The basic psychology—that tug-of-war between buyers and sellers—happens on every timescale.
That said, not all timeframes are equal. Patterns that form on higher timeframes, like the 4-hour or daily charts, are generally much more important. Why? Because they're built on a lot more trading activity, which filters out the random 'noise' and chaotic price swings you often see on shorter timeframes. A daily Hammer simply carries more weight than a 5-minute one.
The best way forward is to match your chart timeframe to your trading style. But always, always keep an eye on the longer charts to get a clearer, more reliable picture of the bigger market trend.
Ready to put this knowledge into practice? At The Coin Course, we provide over 50 expert articles and guides designed to turn you into a more confident and skilled crypto trader. Explore our full range of resources at The Coin Course and start mastering the markets today.