You've probably heard some version of this before. “Diversify your portfolio.” “Add a hedge.” “Don't put everything in one basket.” Those lines sound sensible, but they often leave out the key idea that makes them work.
That idea is negative correlation.
If you invest in shares, crypto, funds, or even just follow financial news, understanding what is negative correlation can help you make better decisions. It won't predict the market. It won't remove risk. But it does give you a sharper way to think about why some combinations of assets feel steadier than others, and why a “hedge” sometimes fails exactly when you wanted it most.
What Is Negative Correlation and Why Does It Matter
Say you run a small corner shop. On bright summer days, you sell more cold drinks. On wet, grey days, you sell more umbrellas. Those two sales patterns often pull in opposite directions. More sunshine, fewer umbrella sales. More rain, fewer cold drinks sold. That's the basic shape of negative correlation.
In plain English, negative correlation means two things tend to move in opposite directions. When one rises, the other tends to fall.
That sounds simple, and it is. The tricky part starts when people assume “opposite directions” means “perfect protection”. It doesn't. A negative relationship can be strong, weak, temporary, noisy, or disappear altogether.
Why investors care
For investors, this idea matters because portfolios are made of moving parts. If every asset you own rises and falls together, your portfolio can feel smooth on good days and brutal on bad ones. If some holdings move differently, the overall ride may be less dramatic.
Consider packing for British weather. If you only own sunglasses, you're in trouble when the clouds roll in. If you carry a coat as well, you're better prepared for a change in conditions. Investors use negatively correlated assets for a similar reason. They're trying to avoid relying on one market mood.
Practical rule: Negative correlation is useful because it can reduce the impact of one asset's bad day, not because it guarantees gains.
Where readers often get confused
People usually mix up three separate ideas:
- Opposite movement: Two assets often move against each other.
- Causation: One asset directly causes the other to move.
- Reliability: The relationship will always stay the same.
Only the first point belongs to negative correlation itself. The other two need caution.
That distinction matters even more in crypto. Many newer investors hear that one asset can “hedge” another, then assume the relationship is fixed. In practice, markets change character. A pairing that looks helpful in calm periods may behave very differently when fear takes over.
Visualising How Negative Correlation Works
A good way to understand what is negative correlation is to stop thinking about formulas for a moment and picture movement.
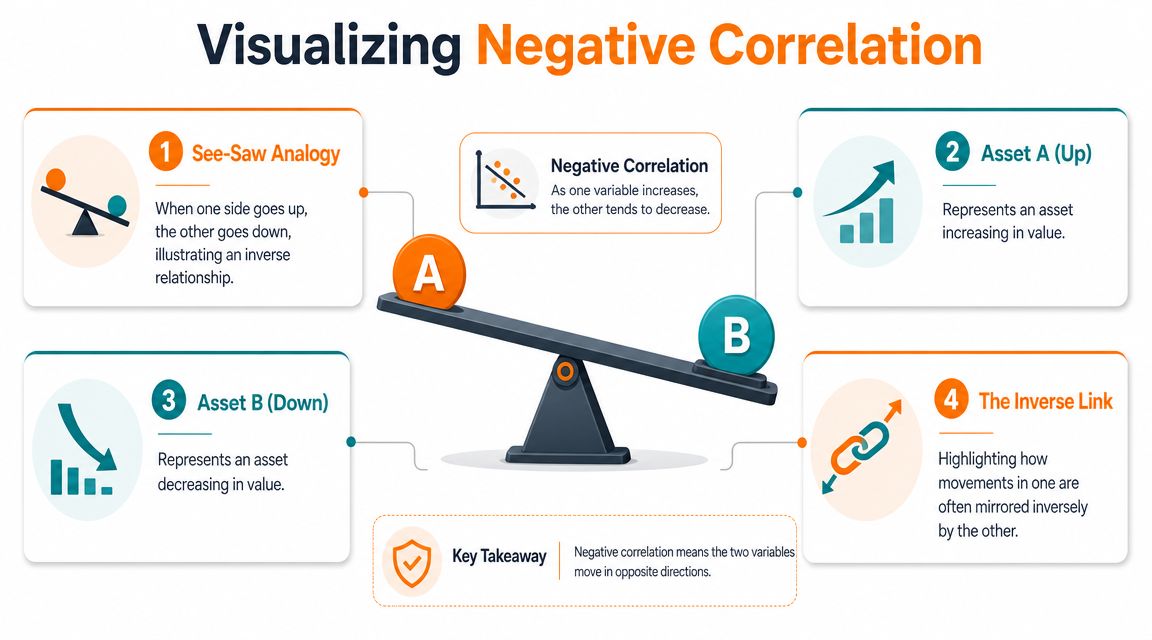
The simplest mental model is a see-saw. When one side rises, the other side falls. It's not a perfect comparison for every real market relationship, but it captures the direction of travel.
The see-saw view
Picture Asset A on one side and Asset B on the other.
If Asset A goes up while Asset B tends to go down, you have an inverse relationship. It won't be perfectly balanced in real life, because markets are messy, but the pattern is the point. One side often lifts as the other drops.
That's why the see-saw analogy helps beginners. It turns an abstract idea into a physical one. You can almost feel the motion.
If you want to build stronger chart-reading instincts around this kind of market behaviour, a beginner to expert guide to technical analysis can help you connect concepts like trend, momentum, and market structure.
What a scatterplot shows
Now move from the playground to a chart.
A scatterplot places one variable on the horizontal axis and another on the vertical axis. Each dot shows a pair of values. When you collect many dots, a pattern appears.
Here's the quick visual guide:
| Pattern of dots | What it suggests |
|---|---|
| Dots slope downward from left to right | Negative correlation |
| Dots slope upward from left to right | Positive correlation |
| Dots look random and scattered | Little or no correlation |
A downward slope means larger values of one variable tend to appear with smaller values of the other. That's the chart version of the see-saw.
Why visual intuition matters
Many people jump straight to the number and skip the shape. That's risky. A single correlation figure can hide a messy relationship, especially if the time period is odd or the market regime has changed.
A visual check can keep you honest:
- Look for consistency: Are the dots broadly following a downward path?
- Watch for outliers: Are a few extreme points creating the impression of a relationship?
- Check for clusters: Do different market periods seem to behave differently?
A chart can show you whether “opposite movement” is a persistent pattern or just a few dramatic days doing all the work.
That's particularly useful in crypto, where relationships can look neat on a summary statistic and much less convincing when you inspect the price action.
Measuring the Strength of a Negative Correlation
A chart can hint at an inverse relationship. The next question is how strong that relationship really is.
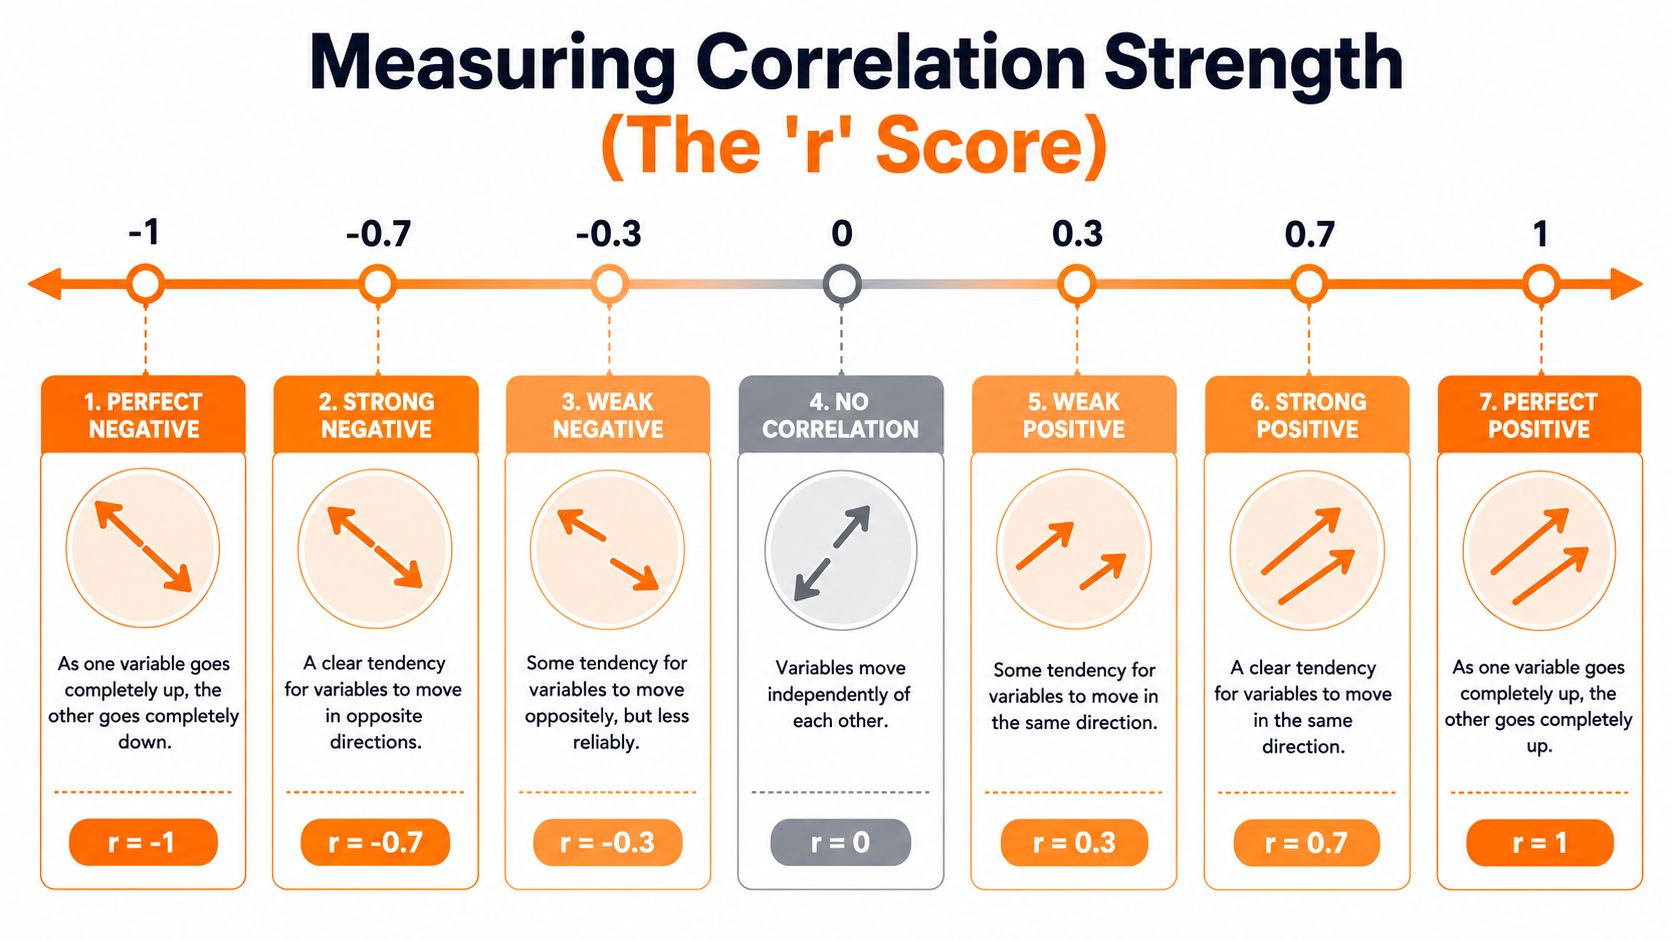
Statisticians usually measure it with the Pearson correlation coefficient, written as r. You do not need to memorise the formula. For investors, it helps to treat r like a dial that runs from assets moving in opposite directions to assets moving in the same direction.
The scale from minus one to plus one
The Pearson correlation coefficient sits between -1 and 1, as explained in this health-statistics overview of correlation and the Pearson coefficient.
Here is the practical reading:
- r = -1 means a perfect negative correlation
- r = 0 means no linear relationship
- r = 1 means a perfect positive correlation
If two assets have an r below zero, they tend to move in opposite directions. The closer that figure gets to -1, the tighter and more consistent that inverse pattern is.
In real markets, perfect scores are rare. You are usually judging shades of grey, not neat textbook extremes.
A simple way to read the score
A useful everyday comparison is a thermostat dial. A small move below zero tells you the room is getting cooler, but not by much. A reading far below zero tells you the change is much more pronounced.
Correlation works in a similar way:
| r value | Plain-English meaning |
|---|---|
| Close to -1 | Very strong inverse relationship |
| Below 0 but not near -1 | Negative, but inconsistent |
| Around 0 | No clear linear relationship |
| Above 0 | Positive relationship |
For a stock or crypto investor, that difference matters. An r of -0.2 and an r of -0.8 are both negative, but they do not offer the same diversification benefit. One is a faint tendency. The other is a much stronger pattern.
Why investors should be careful with the number
Correlation looks tidy on paper. Portfolios do not behave that neatly.
A single score does not tell you:
- Why the relationship exists
- Whether it will hold in the next market regime
- Whether one asset causes the other to move
- Whether the relationship is strong enough to matter after fees, spreads, and taxes
That last point is easy to miss in crypto and global markets. Two assets might show a negative correlation over one period, then move together during a broad risk-off sell-off. UK investors also have to care about practical details, such as dealing costs, platform access, and tax treatment, not just whether the maths looks attractive on a spreadsheet.
A good habit is to read correlation as a clue, not a promise.
Key takeaway: Correlation tells you the direction and strength of a relationship at a given time. It does not guarantee that the relationship is stable, tradable, or useful for your portfolio.
That is why experienced investors rarely stop at the score itself. They check the time period, look at whether the relationship changes in stressed markets, and ask a practical question: if this correlation weakens when I need protection most, is it still doing the job I want?
Negative Correlation Examples in Finance and Crypto
Theory sticks better when you can tie it to familiar market behaviour.
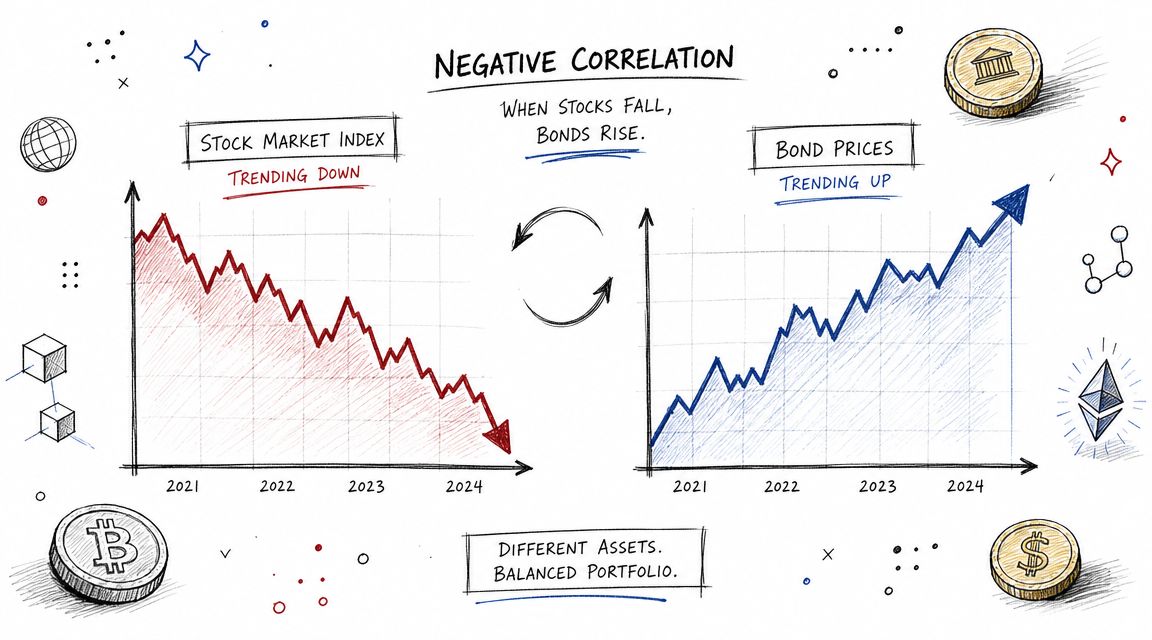
In traditional finance, one of the most common examples involves shares and government bonds. The story often goes like this: investors feel confident, buy riskier assets, and shares do well. Investors get nervous, move towards safer assets, and bonds attract more demand. That can create an inverse pattern between the two.
A classic stock and bond example
Imagine a saver who owns a portfolio of UK or global equities. During calm periods, they may feel comfortable holding more growth-focused assets. During nervous periods, they may want something steadier.
That's why bonds are often discussed as a diversifier. If equities struggle, bonds may hold up better or even rise. The key word is “may”. This is a pattern investors look for, not a law of nature.
A rough everyday analogy helps here. Think of shares as a fast sports car and bonds as a family saloon. They don't respond to the same road conditions in the same way. When the road is smooth and drivers feel bold, the sports car shines. When visibility drops and everyone becomes cautious, the saloon can feel more appealing.
Crypto makes the picture messier
Crypto investors often ask a harder question. Does Bitcoin move opposite to stocks, or with them?
The honest answer is that the relationship has changed over time. Sometimes Bitcoin behaves like an asset with its own rhythm. At other times, especially when broader risk appetite dominates, it can trade more like a high-volatility risk asset.
That's where many textbook explanations fall short. They give the impression that once you identify a negative correlation, you can file it away and trust it. Crypto doesn't make that easy.
Everyday examples compared with market examples
Here's a simple comparison:
| Everyday example | What moves opposite |
|---|---|
| Sunshine and umbrella demand | More of one, less of the other |
| Heating use and outdoor temperature | Higher temperature, less heating |
| Risk appetite and demand for defensive assets | More confidence, less demand for safety |
The financial examples work the same way in principle. Investor behaviour changes, and capital shifts between categories.
Why crypto investors should stay cautious
Crypto also creates a special problem. Even if an asset appears negatively correlated with another over one stretch of time, the relationship can flip when markets become stressed.
For practical UK investing, that matters because a diversified portfolio can reduce overall volatility when assets are not moving together. The Bank of England's Financial Stability Report has repeatedly stressed that these diversification benefits can weaken when correlations rise during stress, so investors should test whether a hedge is negatively correlated in practice under UK market conditions rather than relying on long-run averages, as discussed in this Bank of England-focused explanation of diversification and correlation in investing.
That idea is easy to miss when you're looking at a neat chart from a calm period. In a sell-off, investors often don't separate assets as neatly as theory suggests. They sell what they can, reduce risk broadly, and relationships that once looked helpful can tighten or break.
How to Use Negative Correlation to Build a Stronger Portfolio
Knowing what is negative correlation is useful. Using it well is harder.
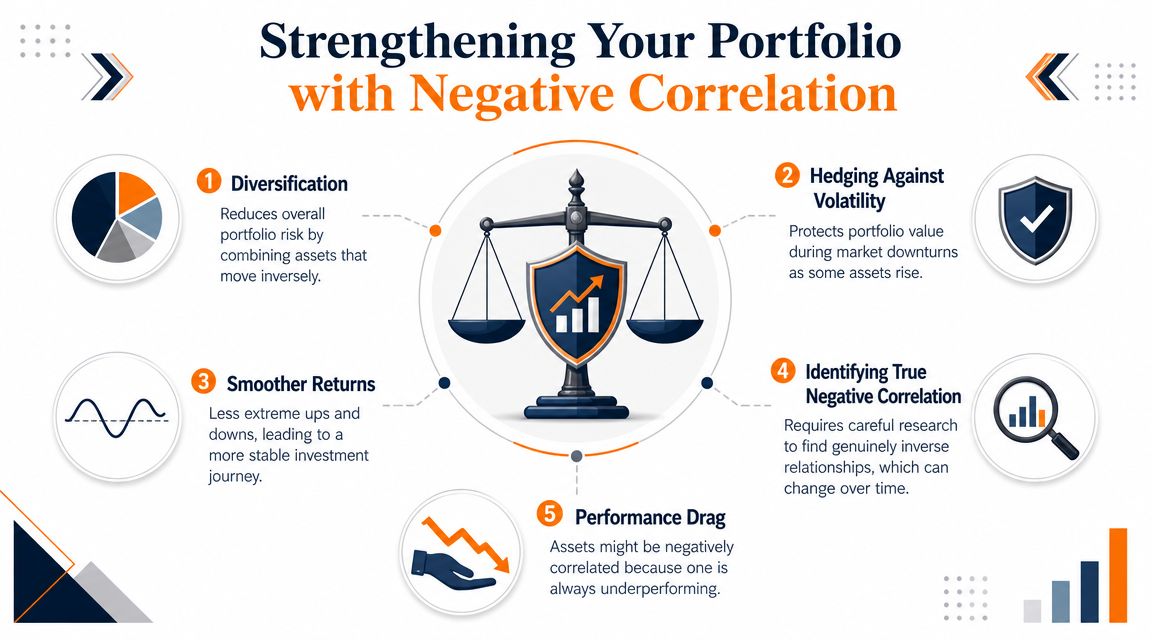
At portfolio level, the basic idea is straightforward. If you combine assets that don't move in lockstep, one holding may soften the blow when another struggles. That can make the overall journey feel less violent.
What a hedge is really doing
A hedge isn't magic. It's just an offset.
If one part of your portfolio is vulnerable to a particular type of market move, you may add something that tends to behave differently. The hope isn't that every position wins at the same time. In fact, with a hedge, you often expect one part to disappoint while another helps.
A practical way to think about it is this:
- Growth holdings try to capture upside.
- Defensive holdings try to reduce damage.
- Negatively correlated positions aim to balance each other when conditions change.
If you want to explore that balancing act in a crypto-specific setting, this guide to building a diversified crypto portfolio is a useful next step.
A short explainer can make the portfolio angle easier to picture:
The real-world frictions investors forget
Many clean examples often fall short. A negative correlation only helps if it can be applied in practice.
Here are the common frictions:
- Trading costs: Buying and rebalancing a hedge can eat into the benefit.
- Liquidity: An asset may look useful on paper but be awkward to trade at a fair price.
- Tax treatment: Selling positions to rebalance can create tax events.
- Timing risk: A relationship that worked last quarter may fail during a shock.
For UK investors, those details matter. A hedge that looks clever in a spreadsheet may become less attractive once fees, spreads, and tax consequences enter the picture.
Some investors focus so much on finding the “perfect” negative correlation that they forget to ask whether the strategy is cheap, liquid, and manageable after tax.
A better way to think about portfolio use
Instead of asking, “What asset always moves opposite to my portfolio?”, ask better questions.
Is the relationship stable enough to matter?
A brief inverse patch isn't much use if it vanishes under pressure.Can I hold it without constant tinkering?
A complicated hedge can create its own problems.Will costs outweigh the benefit?
Even a sound idea can lose value after execution frictions.What role does this asset play?
Some assets are there for growth. Some are there for resilience. Don't judge both by the same standard.
The strongest portfolios often aren't built from perfect opposites. They're built from sensible combinations, realistic expectations, and regular review.
Common Mistakes When Interpreting Correlation
A UK investor sees Bitcoin drop on the same week that gold or a defensive stock fund rises, then assumes they have found a reliable hedge. That conclusion can be expensive. Correlation is useful, but it is easy to read too much into it.
The oldest mistake still catches smart investors. Correlation does not prove causation.
Two assets can move in opposite directions without one directly affecting the other. Both may be reacting to the same background force, such as changing interest-rate expectations, a shift in risk appetite, tighter liquidity, or broad market stress. In other words, the pattern is real, but the story attached to it may be wrong.
Mistake one is turning a pattern into a story
Investors naturally look for tidy explanations. If Bitcoin falls while bonds rise, it feels satisfying to say one move explains the other. Sometimes there is a sensible link. Sometimes the explanation is just a neat label placed on messy price action.
Correlation works a bit like noticing that umbrellas and wet pavements appear together. The relationship is visible. It still does not mean umbrellas caused the rain. In markets, the hidden driver is often a larger force that affects both assets at once.
That is why correlation should be treated as descriptive first. It shows how two assets have moved relative to each other. By itself, it does not explain why.
Mistake two is assuming the relationship is permanent
This mistake causes significant damage.
A negative correlation can look dependable in a calm period, then weaken or reverse when markets come under pressure. That matters even more for investors mixing crypto with shares, commodities, or funds, because crypto relationships are often less stable than a textbook example suggests.
The Bank of England has warned that cryptoasset prices can be highly volatile and that links with other risk assets may strengthen during stress. The FCA has also highlighted the scale of UK crypto ownership in its Financial Lives 2024 survey, which is one reason this is not just a theory problem. It affects real portfolio decisions made by ordinary investors.
If you hold digital assets, it helps to pair correlation analysis with practical risk control in crypto markets. A hedge that looked sensible last month may behave very differently in a fast sell-off.
A quick checklist before trusting a correlation
| Question | Why it matters |
|---|---|
| Is this relationship recent or long-running? | Short samples can give a false sense of reliability |
| Has it held up during market stress? | Calm periods often flatter weak relationships |
| Is there a plausible economic reason? | A pattern with no logic behind it can vanish quickly |
| Can I trade and rebalance it at reasonable cost? | Fees, spreads, and taxes can cancel out the benefit |
Treat a historical negative correlation as a clue, not a promise.
If you want clear, practical crypto education without the jargon overload, The Coin Course is a strong place to keep learning. It covers fundamentals, portfolio building, trading, security, and blockchain concepts in a way that helps beginners and active investors make better decisions with more confidence.