
Market capitalization is the total market value of an asset's circulating supply, calculated by multiplying its current price by the number of coins or shares available. For example, a token priced at £2 with 10 million circulating coins has a market capitalization of £20 million.
You may already have seen this number while comparing coins on a crypto tracking app. One asset costs only a few pence, while another trades for hundreds of pounds, yet the cheaper coin appears higher in the rankings. That can feel backwards until you separate unit price from total supply.
Market capitalization answers one focused question: what value does the market currently assign to all the circulating units? It doesn't tell you how much cash investors originally paid, how much money sits in a project's bank account, or how easily you could sell a large holding. Those differences matter greatly in crypto, where a large headline valuation can create an illusion of liquidity.
Understanding the Core Concept of Market Capitalization
Suppose you open a dashboard and see two tokens:
- Token A costs £0.05 and has a very large circulating supply.
- Token B costs £250 but has a much smaller supply.
Looking only at price, Token B appears more valuable. Market capitalization may tell a different story because the calculation considers every circulating unit, not just the price of one unit.
The formula is simple:
Market capitalization = current price × circulating supply
If a token trades at £0.05 and 10 billion coins circulate, the calculation is £0.05 × 10 billion. If another token trades at £250 and only 1 million coins circulate, its calculation is £250 × 1 million. A low-priced coin can therefore have a higher total market value than a high-priced coin.
What the number represents
Market capitalization is the aggregate value investors assign to an asset at a particular moment. In traditional equities, it usually means the current share price multiplied by the relevant number of outstanding shares. In crypto, platforms generally use the current token price multiplied by circulating supply.
The figure changes when either part of the formula changes:
- The price moves because buyers and sellers trade.
- The circulating supply changes because tokens enter circulation, leave circulation, or the reporting methodology changes.
That means market cap isn't the amount of money invested in an asset. If the latest trade occurs at a higher price, the displayed value of every circulating coin can rise, even though the latest trade involved only a small amount of cash. The value is a market estimate, not a bank balance.
Practical rule: Treat market capitalization as a scale indicator. Don't treat it as proof of cash reserves, revenue, profits, or the amount you could withdraw immediately.
The same idea applies to listed companies. Historical London Stock Exchange market-capitalisation data shows why the date, currency, market coverage, and methodology must accompany any comparison. A figure is meaningful only when you know what it measures and when it was recorded.
For a broader introduction to crypto rankings and dominance, understanding crypto market cap and dominance can help you connect an individual token's valuation with the size of the wider market.
Calculating Market Value with Real World Examples
The quickest way to make the formula familiar is to work through ordinary GBP examples.
Start with a token priced at £2. If 10 million coins are circulating, multiply £2 by 10 million:
£2 × 10,000,000 = £20,000,000
The token's market capitalization is therefore £20 million. That doesn't mean £20 million has flowed into the project. It means the latest market price, applied across the reported circulating supply, produces that displayed valuation.
Now compare it with a more expensive token. Assume Token B costs £100, but only 100,000 coins circulate:
£100 × 100,000 = £10,000,000
Token B has the higher unit price, but the lower market capitalization. Token A costs less per coin and still has twice the total market value because its supply is much larger.
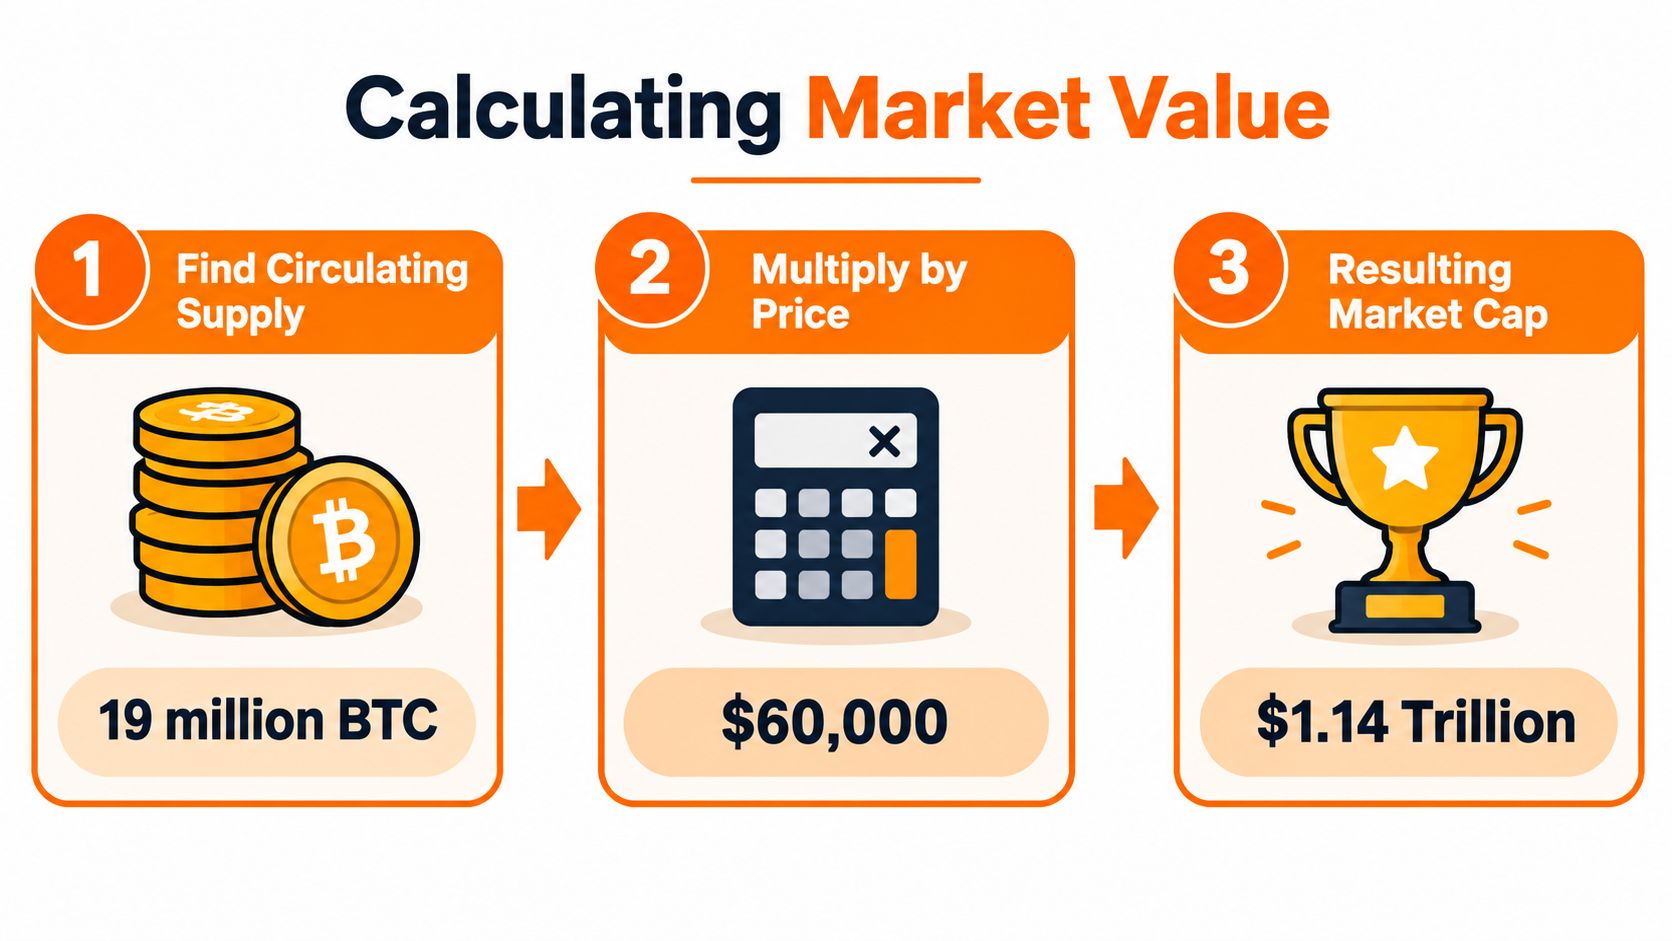
Price changes can do all the work
Consider a token with 100 million coins in circulation. At £0.50, the calculation is:
£0.50 × 100 million = £50 million
If the price rises to £0.75 while supply stays at 100 million, the calculation becomes:
£0.75 × 100 million = £75 million
The market capitalization rises from £50 million to £75 million, a 50% increase caused entirely by the price change, as illustrated by the Bank of England's explanation of cryptoasset market movements.
The reverse is also true. If the price falls while supply stays unchanged, market cap falls with it. No coins need to disappear for the valuation to shrink.
Keep valuation methods separate
Crypto investors sometimes compare market capitalization with traditional valuation techniques. They answer different questions. Market cap reflects the current market price, while a discounted cash flow approach estimates value from expected future cash flows and assumptions. A separate DCF valuation guide from Lighthouse Consultants can help you understand that distinction when analysing companies rather than tokens.
The mental maths is useful, but supply data deserves equal attention. Always ask whether the displayed supply is circulating, whether future releases are scheduled, and whether different platforms use the same definition.
Comparing Traditional Equities and Crypto Assets
A share price can rise because one small trade occurs at a higher level. The company has not necessarily received new cash, yet its headline market capitalisation rises across all shares. Crypto assets can create the same illusion of liquidity, often with thinner order books and trading spread across many venues.
The formula looks similar across markets, while the surrounding systems differ. A London-listed company operates within established reporting and regulatory arrangements. A crypto project may trade continuously across multiple exchanges, with supply information distributed across blockchains, project documents, and data platforms.
For a traditional company, market capitalisation generally uses the share price and relevant outstanding shares. Analysts can place that figure beside revenue, earnings, debt, cash, and assets. Market capitalisation is still different from enterprise value, which accounts for debt and excess cash in a way market cap does not. Neither measure tells you how much money could be withdrawn at the quoted price.
UK regulatory practice also shows that market cap is not always treated as one live intraday figure. HM Revenue and Customs guidance describes a period-average approach for a recognised-growth-market test, using closing market capitalisations from the last trading day of each calendar month during the qualifying period. Using several observations reduces the influence of a temporary price spike or crash.
How indices use market capitalisation
The FTSE 100 shows how market value affects exposure. The FTSE 100 is a market-capitalisation-weighted index of the 100 largest qualifying companies traded on the London Stock Exchange, according to the London Stock Exchange index document. A constituent with a larger market value therefore has greater influence on the benchmark.
This is not equal weighting. If a large constituent has a substantial index weight, its price movement affects the benchmark more than the same percentage movement in a smaller constituent. An index fund therefore gives investors exposure shaped by company size, rather than an identical slice of every holding.
Crypto rankings may look comparable, but their supply and liquidity can change quickly. Scheduled token releases can add previously restricted units to the market. Burns can remove units. Treasury holdings, staking arrangements, wrapped assets, and reporting methods can all affect the circulating-supply figure. A headline market cap can rise without matching cash inflows, because the calculation reprices existing units from the latest trade.
| Feature | Traditional Equities | Crypto Assets |
|---|---|---|
| Ownership unit | Shares in a company | Coins or tokens linked to a network or project |
| Trading schedule | Structured exchange sessions, depending on the market | Often continuous trading across multiple venues |
| Supply changes | Share issuance, buybacks, splits, and other corporate actions | Scheduled token releases, burns, emissions, staking, treasury movements, and reporting changes |
| Related analysis | Revenue, earnings, assets, debt, cash, and enterprise value | Token utility, network activity, liquidity, scheduled token releases, wallet concentration, and fully diluted valuation |
| Benchmark use | Market-capitalisation-weighted indices such as the FTSE 100 | Rankings and dominance measures, with methodologies that can differ by platform |
For a closer explanation of supply mechanics, decoding tokenomics and crypto asset economic systems gives useful context. Visbanking crypto banking insights examines how banks are being pushed into crypto, showing how quickly market structure can shift while regulation varies by jurisdiction.
Navigating Large Mid and Small Cap Categories
Crypto investors often use large-cap, mid-cap, and small-cap as shorthand for an asset's relative size. These labels can make a list easier to scan, but they don't have one universal legal threshold. One platform's category may not match another's, so check the methodology before treating a label as a precise classification.
A large-cap asset generally has a greater established market presence and may have deeper trading activity than a smaller project. That doesn't remove risk. Its price can still fall sharply, and its market capitalization can still reflect a price that would be difficult to maintain during heavy selling.
Mid-cap assets sit between the biggest networks and the smallest projects. They may have a functioning product, a growing user base, or a developing ecosystem, but their market value can remain more sensitive to a change in sentiment. Research, exchange availability, token releases, and wallet concentration deserve close attention.
Small-cap projects can attract attention because a relatively modest change in price may create a noticeable change in ranking. They can also have thinner order books, concentrated ownership, uncertain utility, and a greater risk that the quoted price doesn't represent a level at which a large holder could exit.
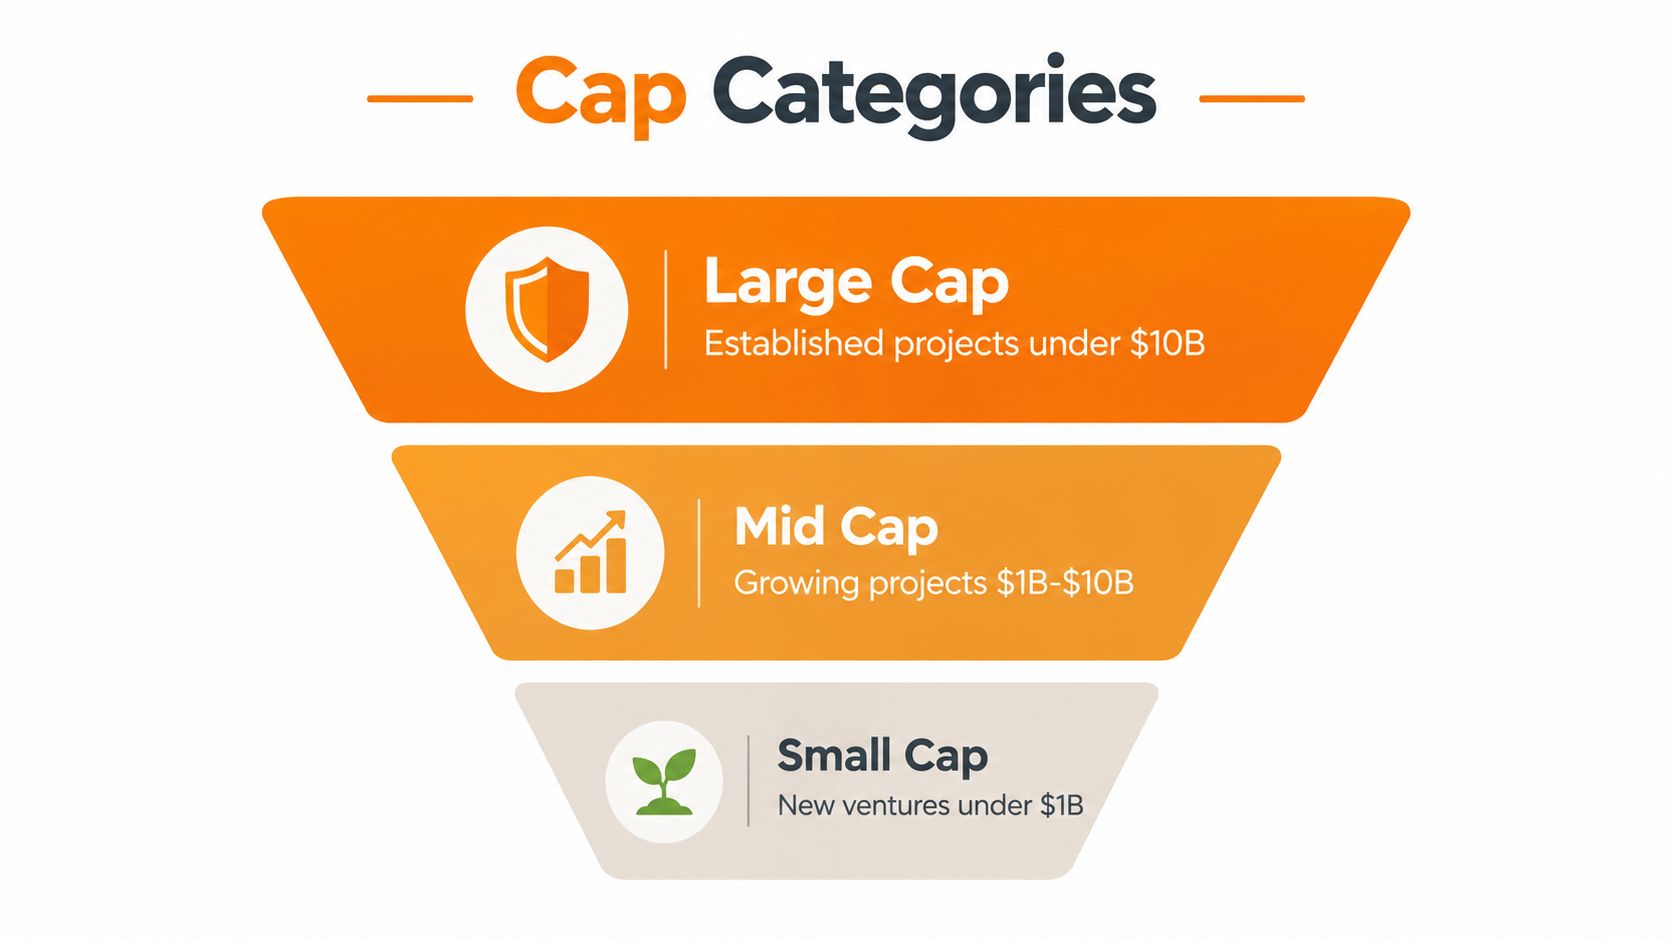
Why concentration changes the picture
The overall crypto market isn't evenly distributed across thousands of assets. The FCA reported a global cryptoasset market capitalization of $3.3 trillion in July 2025, while Bitcoin's share rose from 41% in January 2023 to more than 60% in July 2025, as set out in its cryptoasset regulatory analysis.
That concentration has a direct practical effect. A 10% move in Bitcoin can alter the total market capitalization far more than a 10% move in a small token. When a dashboard says the crypto market is rising, check whether the movement comes from broad participation or from a few dominant assets.
Use cap categories as a starting point, not a complete risk model:
- Large cap: Often offers more established market visibility, but size doesn't guarantee liquidity or safety.
- Mid cap: May combine an operating ecosystem with meaningful execution risk and supply changes.
- Small cap: Can offer exposure to newer ideas, but price discovery may be fragile and exit conditions may be poor.
A category helps you organise research. It shouldn't replace research into token economics, trading activity, ownership, and the project's actual use.
Recognising the Hidden Limitations of Market Valuation
A market capitalization figure can look substantial while the market contains very little immediately available cash. This is the illusion of liquidity, and it catches out beginners who assume they could sell a large position at the displayed price.
Suppose a thinly traded token has a quoted price based on the latest transaction. That price is then multiplied across the circulating supply. If the last buyer paid that price for a small amount, the platform may still display the same price as the estimated value of every circulating token.
The FCA describes this problem directly: a small trade at the latest price can revalue every circulating unit even though only a small amount of cash changed hands, making rankings misleading in thinner crypto markets, as explained in its 2025 cryptoasset consumer research.
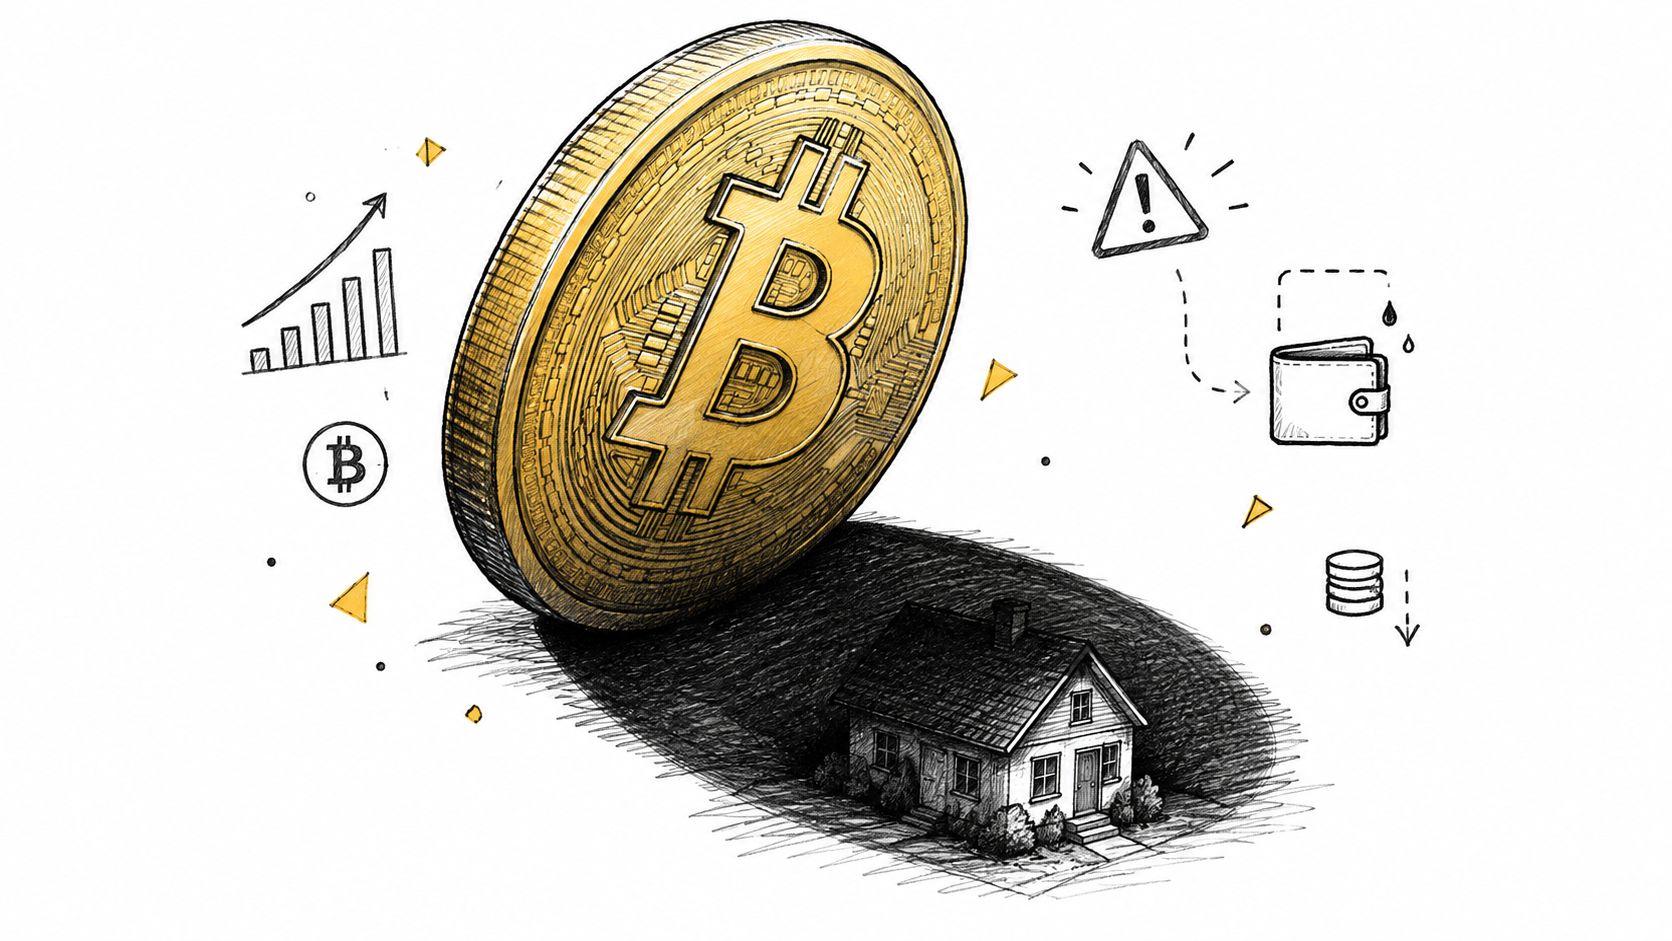
Why a sale can move the price
An order book contains available bids and offers at different prices. If buyers have placed only small bids near the current price, a larger sell order may consume those bids and reach much lower levels. The seller won't necessarily receive the displayed market price for the whole position.
That creates a gap between valuation and exit capacity:
- Market cap asks: What is the latest price multiplied by circulating supply?
- Liquidity asks: How much can you buy or sell before the price moves materially?
- Cash-flow reality asks: How much money changed hands to establish the latest price?
Locked tokens and treasury holdings can make the reported circulating supply difficult to interpret. A project may also have tokens scheduled for release, creating future selling pressure even when today's market cap appears stable. Holder concentration matters too, because a few wallets may control enough supply to influence price.
A large market cap tells you how the market is pricing the circulating supply. It doesn't promise that the market can absorb your order.
This distinction matters for UK users as well as global traders. FCA research estimated that about 7 million UK adults, or 12% of the adult population, owned cryptoassets as of August 2024, with average holdings of approximately £1,850, producing an estimated UK retail consumer market of about £12.6 billion in that analysis, as reported in the FCA consultation material on cryptoasset consumer holdings. That estimate describes UK consumer holdings, not the global market capitalization of a coin. The two figures answer different questions.
For a broader look at how summaries can hide important detail, you can browse Artul.ai blog posts. The same discipline applies here: don't accept a headline number without checking what sits behind it.
Evaluating Crypto Projects Beyond the Headline Number
Market cap becomes more useful when you place it beside other measures. No single metric can reveal whether a token is healthy, easy to trade, fairly priced, or supported by genuine usage.
Start with 24-hour trading volume, but don't treat volume as automatically genuine or sufficient. Compare it with the order book, the exchange venues reporting it, and the spread between the best available buy and sell prices. A narrow bid-ask spread can suggest easier execution, while a wide spread warns that even a modest order may receive a poor fill.
Four checks that add context
Fully diluted valuation estimates the value implied if the project's full planned supply were in circulation. Compare it with current market capitalization and read the token release schedule. A large gap may indicate that future token releases could significantly expand supply and change the balance between buyers and sellers.
Circulating-supply quality deserves careful inspection. Ask which wallets and allocations the data provider excludes. Check whether team, investor, foundation, staking, or treasury tokens are locked, transferable, or included in the published number. Two platforms can show different market caps because they use different supply methodologies.
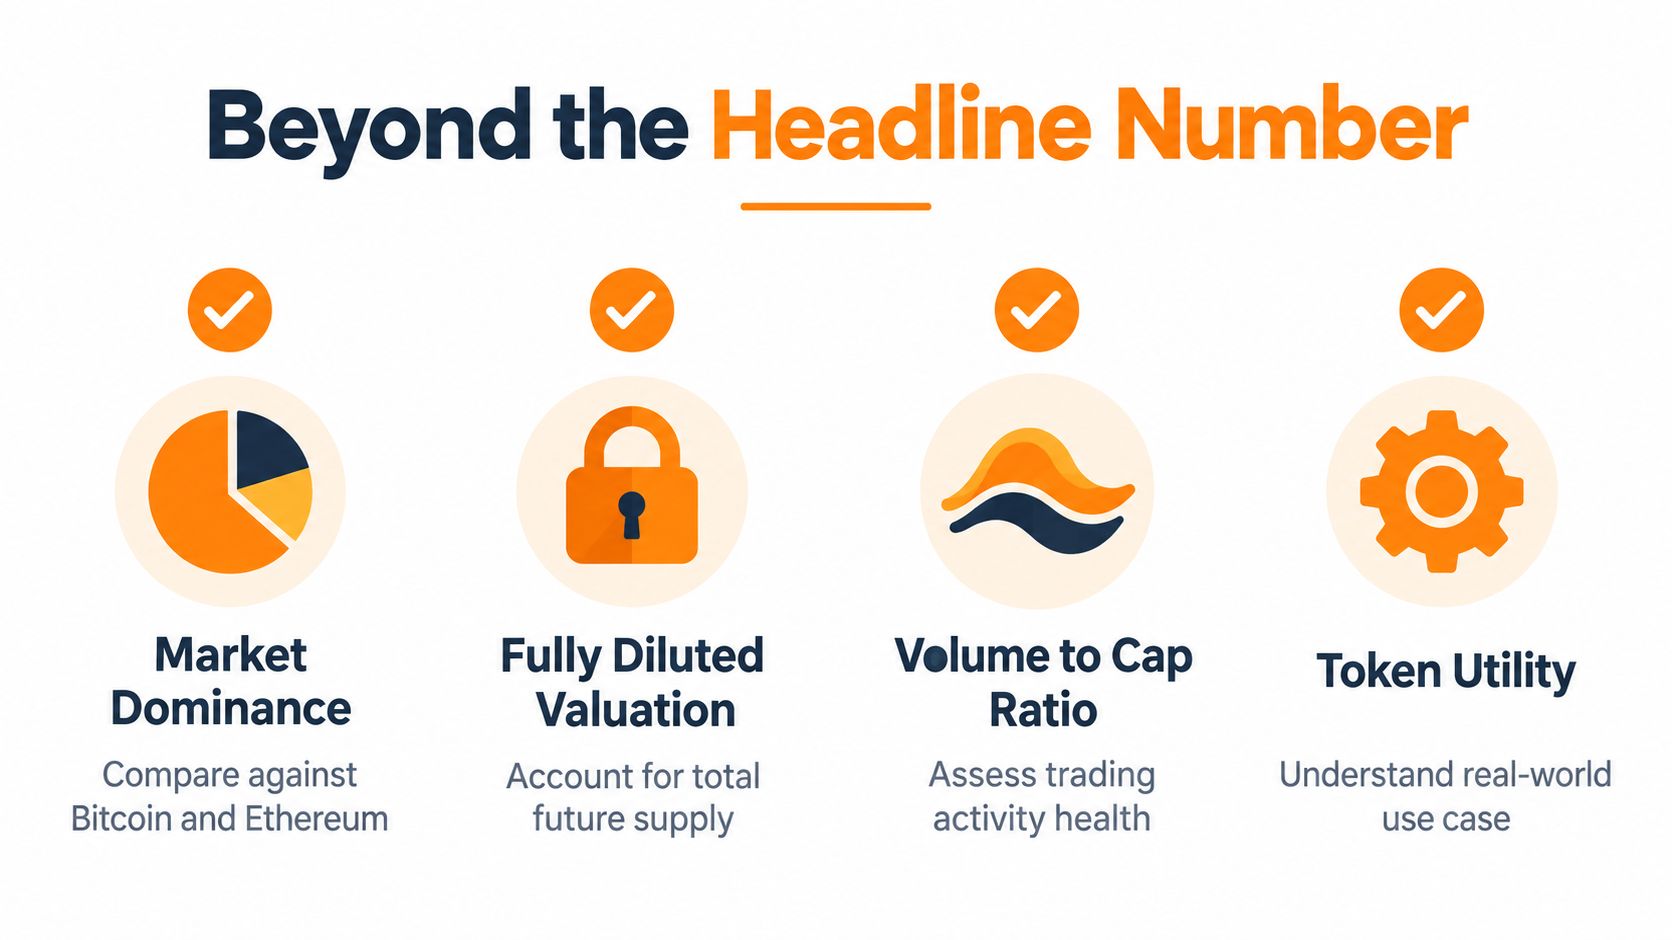
Holder concentration reveals who can affect the market. Explore on-chain wallet distribution where reliable data is available, then distinguish exchange wallets, smart contracts, foundation addresses, and identifiable large holders. A token with many apparent addresses may still have meaningful control concentrated among a small group.
Utility and activity connect the token to its claimed purpose. Look at what the network enables, who uses it, whether the token is necessary for that activity, and whether demand depends mainly on speculation. A high valuation without corresponding use deserves more careful questioning.
A practical reading sequence
Use this order when researching a new project:
- Confirm the price and circulating supply. Record the timestamp and the data source.
- Compare market cap with fully diluted valuation. Read upcoming token release schedules rather than relying on a single ratio.
- Inspect trading conditions. Check volume, spreads, exchange depth, and whether the market is active enough for your intended position.
- Review ownership. Look for concentrated wallets, treasury control, and investor allocations.
- Test the use case. Ask whether the token performs a necessary function or mainly represents a tradable narrative.
The fundamental analysis guide for altcoin investments can help you turn those checks into a repeatable research process. The key is to compare several signals instead of allowing one ranking number to decide your view.
Building a Smarter Investment Strategy
A token's market capitalisation can rise while very little new cash enters the market. If the latest trades occur at a higher price, that price may be applied across the circulating supply, creating a much larger headline valuation. The result can resemble a large property valuation based on one recent sale, even though selling every property at that price would be impossible.
Build your strategy around that difference. Examine how much is trading, the spread between buy and sell orders, and the depth available near the quoted price. A small project may show a striking percentage gain while offering limited room for an investor to exit without pushing the price down.
For a UK investor, check the trading venue's regulatory position and the quality of its reported market data. FCA registration or a UK-facing service does not make a token safe, liquid, or suitable for every investor. Treat regulatory information as one check alongside the project's documents, token supply, and trading conditions.
Set a position size before buying, and decide what would make you reduce or close it. A larger market cap may support easier execution, but it does not remove volatility. A smaller asset may offer growth potential while carrying wider spreads and greater execution risk.
Use market capitalisation as a starting label, not a verdict. The Coin Course provides structured guides for practising token comparisons, supply analysis, and broader crypto research before you evaluate your next project.