
You're probably here after seeing a trader post a clean screenshot, a few candles, and a fast profit. It looks simple. Buy the move, sell a bit later, repeat.
Real crypto day trading doesn't feel like that.
Most sessions are waiting, ignoring bad setups, and protecting capital when the market turns ugly without warning. The people who last aren't the ones with the hottest opinions on X or the loudest Discord calls. They're the ones who can follow a plan when price starts moving fast and their pulse does the same.
For a UK trader, there's another layer. You're not trading in a vacuum. Regulation affects which products you can access, platform choice matters, and taxes don't disappear just because a trade only lasted twenty minutes. If you want to approach this properly, treat it less like a gamble and more like running a small trading operation from your desk.
What Is Crypto Day Trading Really Like
Crypto day trading means opening and closing trades within the same day. You're trying to capture short-term price moves, not hold for months and hope a coin trends higher over time. That difference sounds obvious, but it changes everything about how you think, plan, and act.
Investors can be broadly right and still do well. Day traders need timing, discipline, and clean execution. A good long-term project can still be a terrible intraday trade if you buy into resistance, chase a fake breakout, or ignore fees.
In the UK, this sits inside a market with a lot of retail attention. The FCA estimated in 2024 that around 12% of UK adults owned cryptoassets, while also warning that cryptoasset trading is high risk and consumers should be prepared to lose all the money they invest, as summarised by this UK crypto ownership and risk overview. That matters because it tells you two things at once. There's plenty of public interest, and there are plenty of inexperienced participants in a fast market.
What the job actually feels like
A normal day doesn't look like constant action. It looks more like this:
- Pre-market review: You open charts, mark key levels, and decide which pairs are worth watching.
- Long stretches of nothing: Price chops around, spreads widen, and the best trade is often no trade.
- Short bursts of decision-making: When a setup appears, you don't get much time to hesitate.
- Post-trade review: You log what happened, not just whether you made or lost money.
That last point matters. A winning trade taken for bad reasons is still bad trading. A losing trade taken exactly to plan can be good trading.
Practical rule: Day traders don't get paid for being busy. They get paid for being selective.
The reality of Crypto day trading Pros vs Cons
| Pros | Cons |
|---|---|
| Fast feedback: You learn quickly because results arrive the same day. | High pressure: Decisions often need to be made in minutes, sometimes seconds. |
| No overnight exposure: You can close out before sleeping. | Constant temptation: Overtrading is easy when the chart keeps moving. |
| Clear process: Entries, stops, and exits can be defined in advance. | Execution risk: Slippage, fees, and poor entries can ruin a decent idea. |
| Skill-based improvement: Journals and replay work can sharpen performance. | Emotional strain: Fear after losses and greed after wins can distort judgement. |
Prediction is overrated
New traders think the job is forecasting the next move. It isn't. The job is building a process around probabilities.
Take a simple BTC/USDT example. Price spends hours moving sideways under a clear ceiling. A new trader says, “It's definitely breaking out.” A better trader says, “If buyers push through that level and hold above it, I'll take the trade. If they fail, I'll stand aside.” One person is guessing. The other is reacting to evidence.
That's the shift you need to make early. Don't marry a bias. Build a plan for both outcomes.
Your Essential Day Trading Setup in the UK
Your setup doesn't need to look like a hedge fund desk. It does need to be clean, secure, and built for fast decisions. If you're fumbling between apps, resetting passwords, or moving funds at the last second, you're adding risk before the trade even starts.
For UK traders, one rule shapes the playing field straight away. The FCA banned the sale, marketing, and distribution to retail consumers of derivatives and ETNs referencing unregulated cryptoassets, effective 6 January 2021, as covered in this summary of the FCA retail derivatives ban. In practice, that pushes most retail traders towards trading the underlying coins on spot markets rather than using the kind of products offering magnified trading exposure you may see discussed in overseas trading content.
Choose the right venue first
For active day trading, a high-volume centralised exchange is usually the practical starting point. Platforms such as Kraken or Coinbase tend to be easier for order entry, chart access, and liquidity than a decentralised exchange if you're still building your process.
That doesn't mean decentralised exchanges are bad. It means they often add extra moving parts. Wallet connection, on-chain fees, and thinner liquidity can all get in the way when you're trying to trade short-term momentum.
If you're comparing venues, this guide on choosing the right crypto exchange for spot trading is a good place to sort out the trade-offs.
Build a simple trading cockpit
Think of your setup like a small workshop. Every tool should have a purpose.
Exchange account Use one main exchange for execution. Don't scatter small balances across too many platforms at the start.
Charting screen TradingView is the common choice for chart analysis because it's clean and easy to customise. Even if you place trades on the exchange itself, many traders still do their chart work elsewhere.
Watchlist Keep it short. BTC/USDT, ETH/USDT, and one or two other liquid pairs are enough for a beginner. Too many charts leads to noise.
Order types Learn the difference between market, limit, and stop orders before you trade live. This isn't admin. It affects price, slippage, and risk.
Security isn't optional
New traders often treat security like a side task. That's a mistake.
- Use two-factor authentication: App-based 2FA is far safer than relying only on a password.
- Separate trading funds from long-term holdings: Keep active capital where you trade. Keep longer-term assets elsewhere.
- Record your logins and backup codes safely: You don't want to be locked out when the market is moving.
- Check withdrawal settings: Make sure you understand address whitelists and account protections.
A slick trading setup means very little if your account security is weak.
Wallets and working capital
A hot wallet or exchange balance can make sense for active trading capital because speed matters. That doesn't mean every coin you own should sit there.
A practical split is simple. Keep the money you need for trades accessible. Keep anything you're not using out of the firing line. Day trading works best when your trading stack is lean and boring.
Learning to Read the Crypto Market
Charts look messy until you know what you're looking at. Then they start to read more like a conversation between buyers and sellers. Not a perfect one, and never a guaranteed one, but a readable one.
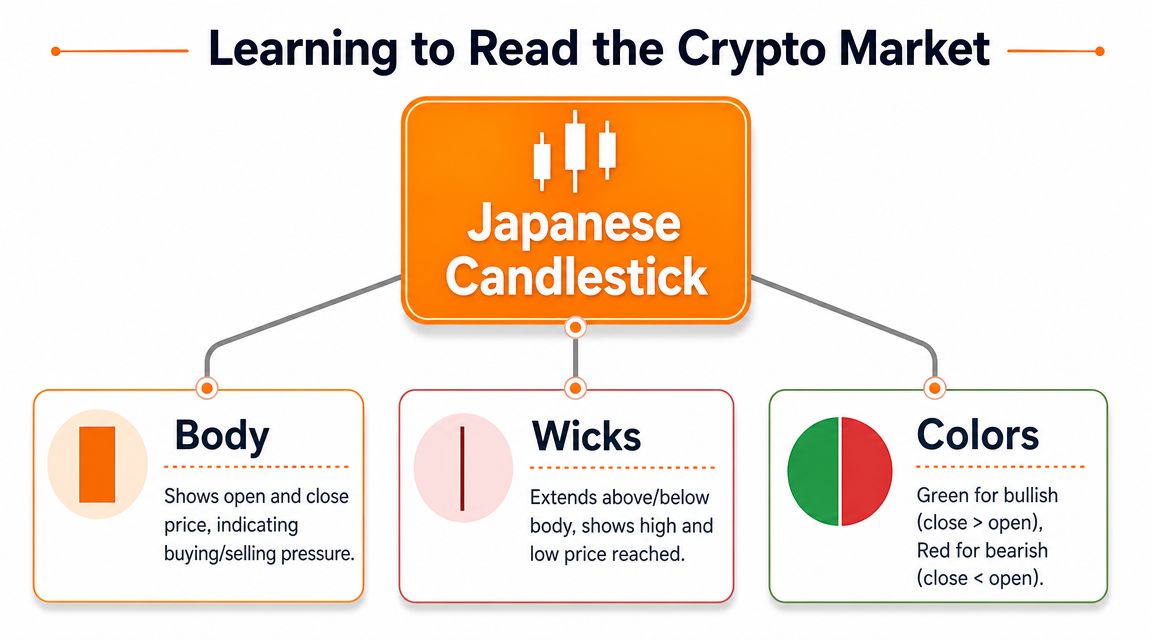
The first thing to learn is the Japanese candlestick. It's the basic unit of price action. If you can read one candle, then a group of candles starts to tell a story.
For a fuller breakdown of chart basics, this explainer on decoding crypto markets and spotting trends is worth keeping open next to your charts.
Read the candle before you read the pattern
Each candlestick shows four things for a chosen time frame: the open, close, high, and low.
- Body: The thicker part shows the distance between open and close.
- Wicks: The thin lines above and below show how far price travelled.
- Colour: Green usually means price closed above the open. Red usually means it closed below.
A long green body with a small upper wick tells a different story from a tiny body with long wicks on both sides. One shows directional control. The other shows indecision and a tug of war.
If BTC/USDT prints several small candles under the same price ceiling, that can suggest compression. Buyers are pushing, but not yet getting through. If the next candle closes strongly above that ceiling, the story changes.
Support and resistance are your floor and ceiling
The simplest useful concept in day trading is support and resistance.
Think of support like a floor. Price falls into it and often bounces. Resistance acts like a ceiling. Price rises into it and often stalls.
They aren't magic lines. They're zones where traders have shown interest before.
Here's a practical way to mark them:
- Zoom out first: Start on a higher time frame such as the 1-hour chart.
- Mark repeated reactions: If price keeps turning near the same area, it matters.
- Drop lower for detail: Move to the 15-minute chart to refine the zone.
- Treat it as an area, not a razor-thin line: Price often overshoots slightly before reacting.
Volume tells you whether the move has weight
Price can break a level and still fail. That's why volume matters.
If ETH/USDT pushes through resistance on weak participation, the move may not stick. If it breaks with clear activity behind it, that usually deserves more respect. Volume is like the volume knob on a conversation. If the market says something important with weak participation, you stay cautious. If it says it loudly, you pay closer attention.
A breakout without participation is often just a trap wearing a convincing outfit.
Use indicators as helpers, not leaders
Many beginners load five or six indicators onto a chart and end up with a glowing mess. Start with one or two.
A moving average helps smooth price action and makes trend direction easier to see. If price is holding above a rising moving average on the 1-hour chart, that can support a bullish intraday bias.
Bollinger Bands can help you see expansion and contraction. Tight bands often suggest price compression. Wider bands usually mean the market is already moving hard.
Use indicators after you've marked structure. Not before. Structure first, tools second.
Simple Day Trading Strategies That Work
You don't need ten strategies. You need one or two setups that are easy to recognise and hard to misread. Most beginners improve faster when they stop hunting novelty and start repeating the same playbook.
Two setups keep showing up in crypto day trading because they fit the market well. One is the breakout. The other is the range trade. They're almost opposites, and that's useful because the market doesn't trend all day every day.
Early in a session, I often ask one question before anything else. Is price trapped, or is it trying to escape? That answer usually points to one of these two setups.
The breakout trade
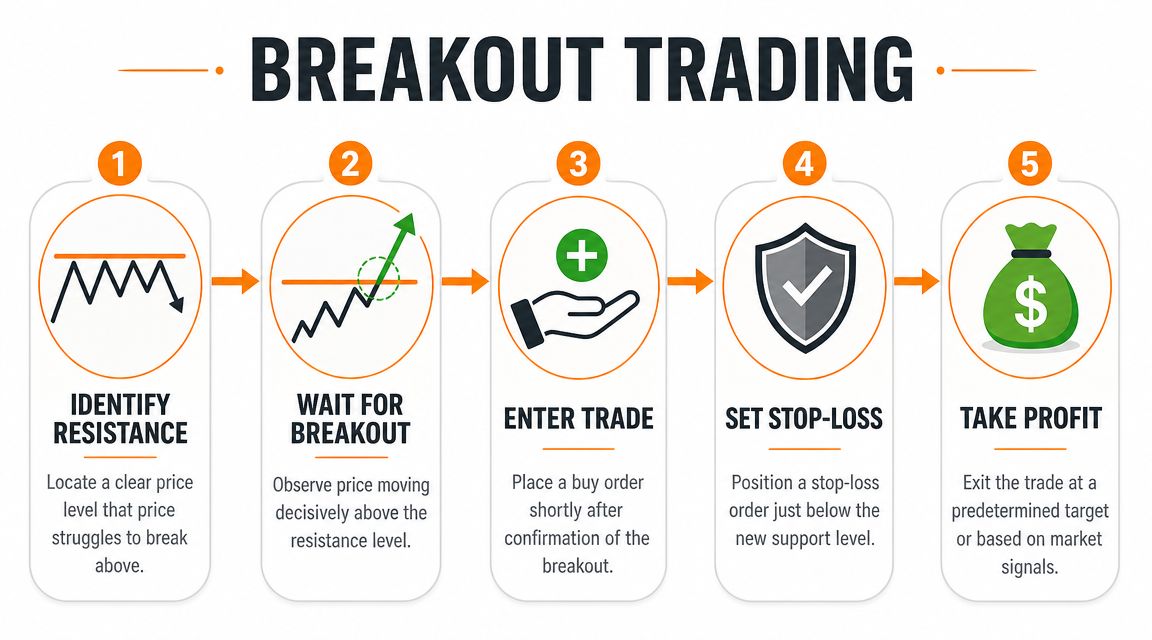
A breakout starts with pressure building under resistance or above support. Price keeps testing the same area, but doesn't immediately reverse. That repeated pressure matters.
Take a BTC/USDT example. On the 15-minute chart, price spends hours pushing into the same resistance level. The candles get tighter. Pullbacks become shallower. That often means sellers are still there, but they're losing control.
Your process can be mechanical:
Find a clean level Mark the area where price has clearly stalled several times.
Wait for confirmation Don't buy the first touch into resistance. Wait for price to break and hold, or break and retest.
Enter with a reason A common trigger is a strong candle close above the level, followed by a small pullback that holds.
Place the stop Put the stop where the setup is invalidated, usually below the breakout zone or retest area.
Plan the exit Decide in advance whether you'll scale out into strength or take profit at the next obvious resistance.
A bad breakout usually shows its weakness quickly. Price pushes above the level, stalls, and falls back inside the old range. If that happens, get out. Don't negotiate with the chart.
For a visual walk-through of the setup in action, this video gives a useful overview:
The range trade
Some days are dull, and that's not a problem if you recognise it early.
In a range, price bounces between support and resistance without commitment. Think ETH/USDT tapping the same lower zone, then drifting back to the same upper zone, over and over. If there's no clean breakout, you can trade the edges instead of waiting for a trend that isn't there.
The recipe is different from the breakout:
- Setup look: Clear horizontal floor and ceiling, with repeated reactions.
- Entry trigger: Buy near support after price shows rejection, or sell near resistance if that fits your market and platform.
- Stop-loss: Just beyond the zone where the bounce idea is proven wrong.
- Take profit: Near the middle of the range for a conservative trade, or near the opposite edge if conditions stay calm.
What usually doesn't work
New traders often sabotage both setups the same way.
- Chasing candles: If BTC/USDT has already launched, the easy part of the move may be over.
- Trading messy levels: If you can't clearly explain the level, skip it.
- Ignoring context: A breakout inside a choppy higher-time-frame range is less reliable than one aligned with the broader trend.
- Forcing action: If price isn't cleanly breaking or cleanly ranging, there may be no trade.
The best setups often look almost boring before they move.
Managing Risk to Survive and Thrive
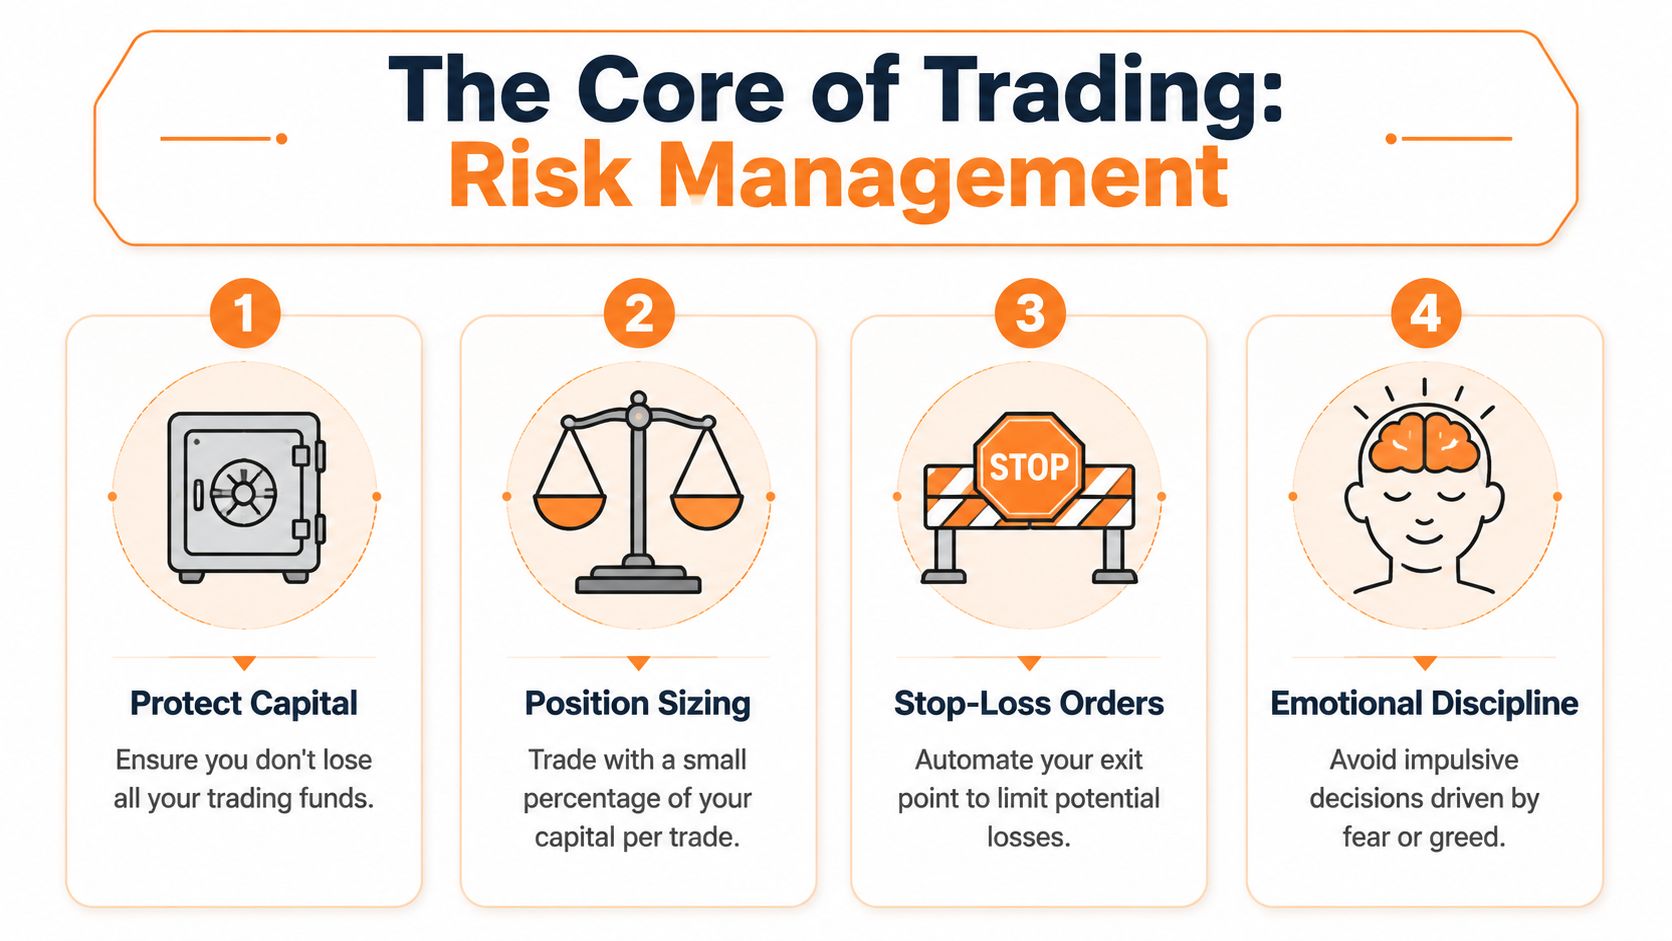
Risk management is the paramount skill. Entries are visible, so beginners obsess over them. Survival is less glamorous, so beginners delay it. That's backwards.
Achieving consistent profitability in crypto day trading is a low-probability endeavor. A trading statistics roundup reports that only about 13% of day traders maintain consistent profitability over six months, and some estimates put the long-run odds of making a living from day trading at roughly 4%, as summarised in this review of day trading success rates and risk control. The same source also highlights the practical value of capping exposure at 1 to 2% of capital.
That's why I tell new traders to stop asking, “How much can I make on this trade?” and start asking, “How little can I lose if I'm wrong?”
Keep the loss small before the trade begins
The cleanest benchmark for a retail trader is simple. Risk only 1 to 2% of capital on a trade day or single idea. That means your position size must be built around the distance to your stop-loss, not around how confident you feel.
If your stop is wide, your position must be smaller. If your stop is tight, your position can be larger. Confidence doesn't change that maths. The chart does.
A practical workflow looks like this:
Mark the invalidation point Decide where the setup is wrong, not where you hope price won't go.
Measure the distance Work out how far entry is from stop.
Size the trade Adjust the position so a stop-out stays inside your risk cap.
Set the exit orders Put the stop-loss and take-profit in before emotions get involved.
Aim for sensible reward relative to risk
Not every trade deserves your money. One fast filter is the risk-to-reward relationship.
If you're risking a certain amount to make less than that, you need a very high strike rate to survive. That's hard. If the setup offers room for a larger upside relative to the defined downside, you give yourself more breathing space over a series of trades.
This doesn't mean every chart will hand you a perfect target. It means you should stop taking cramped setups where the nearest obstacle sits right above your entry.
If the stop has to be wide and the upside is limited, the trade isn't “almost good”. It's bad.
Emotional discipline is part of risk management
A stop-loss on the chart is useful. A stop-loss in your behaviour matters just as much.
The biggest account damage often comes from revenge trading. You take one loss, then another, then decide the next trade must win it all back. Position size creeps up. Patience disappears. The market doesn't care.
Create rules for your own behaviour:
- Stop after a rough patch: If you've taken several poor trades in a row, step away.
- Don't resize out of frustration: Larger trades after losses usually come from emotion, not edge.
- Log the mistake immediately: A bad impulse gets weaker when you write it down.
- Accept boredom: Most bad trades are taken because the trader wanted action.
What professionals protect first
Professionals think in sequences, not single trades. One loss means very little. A month of poor discipline means a lot.
That's why capital protection comes first. If you still have capital and a clear head, you can take the next valid setup. If you damage both in one emotional session, the chart is no longer your main problem.
Tracking Testing and UK Taxes
A lot of new traders focus on charts and ignore records. That's like trying to improve at a sport while refusing to watch your own replays. If you don't track what you're doing, you won't know whether your problem is timing, risk, patience, or taking the wrong setups.
The journal is where your progress becomes visible. Backtesting is where your ideas get challenged before they cost you real money. Tax records are where your trading stops being a hobby in your head and starts being something you can account for in the UK.
Keep a journal that captures decisions
A useful trade journal doesn't need to be fancy. A spreadsheet is enough if the fields are good.
Record things like:
- Pair traded: BTC/USDT, ETH/GBP, or whatever you executed.
- Setup type: Breakout, range bounce, failed retest, and so on.
- Entry and exit reason: Why you got in, and why you got out.
- Market context: Trend, range, news-driven move, or messy chop.
- Your state of mind: Calm, rushed, frustrated, overconfident.
The emotional note is more important than people think. Many traders discover that their worst sessions came after a previous win streak or after trying to recover a loss too quickly.
Test the setup before you trust it
Backtesting sounds technical, but the idea is plain. You go back through historical charts and check whether your setup had a genuine edge or only looked good in memory.
Do this one setup at a time. If you're testing a breakout on BTC/USDT, define the exact conditions first. What counts as resistance? What confirms the break? Where does the stop go? If you keep changing the rules halfway through, you're not testing. You're storytelling.
The journal tells you what you did. Backtesting tells you whether the idea deserved to be traded at all.
UK tax treatment matters even for short trades
This part gets ignored far too often. Fast trading still creates reporting obligations.
For most individuals, HMRC generally treats disposals of cryptoassets under Capital Gains Tax, while income tax can apply in some circumstances depending on the nature of the activity. HMRC has also updated its Self Assessment cryptoasset pages for Tax Year 2024–25, which signals tighter reporting expectations, as explained in this UK crypto tax guide.
That matters because many day traders assume every rapid trade is automatically trading income. It often isn't that simple. The practical takeaway is clear. Keep records from day one.
What to keep for HMRC
Good records save stress later.
- Trade history exports: Download them regularly from your exchange.
- Dates and times: Especially helpful when matching entries and exits.
- Fees paid: They affect your real outcome.
- Wallet transfers: Moving assets between your own wallets can create confusion if you don't label them properly.
If your records are messy, tax season becomes guesswork. Guesswork and tax reporting don't mix well.
A Real Crypto Day Trade Walkthrough
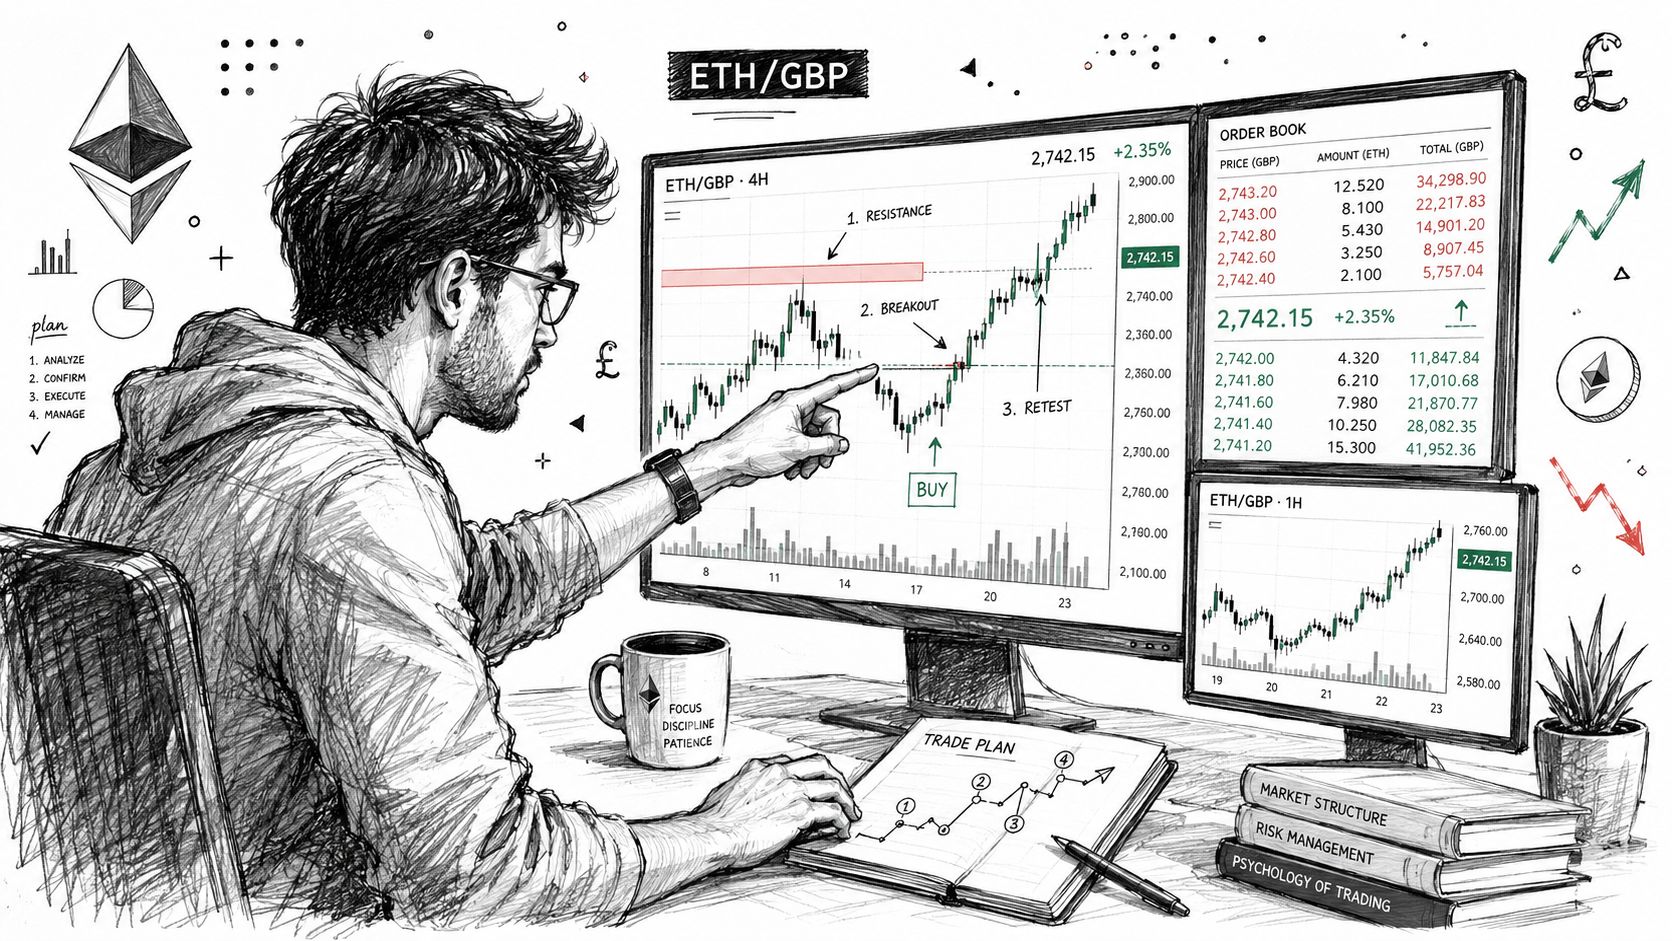
A walkthrough makes all this easier to picture, so let's use a simple example on ETH/GBP. This is not a live signal. It's the kind of structured decision a disciplined trader might make during a normal session.
The chart read
Start on the 1-hour chart. ETH/GBP is trending higher during the session, and price has been respecting a rising moving average. That gives a bullish bias, but not a trade yet.
Drop to the 15-minute chart. Price pushes up, pauses, and forms a small flag just below a prior intraday high. That's a common continuation shape. The move up forms the pole. The tight drift lower forms the flag.
The plan before entry
The setup is only valid if price breaks the top of the flag and holds. The entry goes above that local resistance, not in the middle of the pattern. The stop-loss sits below the lower edge of the flag, where the continuation idea would be invalidated.
The profit target goes near the next obvious resistance area on the left side of the chart. If price reaches that zone quickly and stalls, taking profit makes sense. If momentum stays strong, part of the position could be managed more actively.
The execution
Price breaks upward on a strong 15-minute candle. The trader enters only after the break is confirmed, not on the first hopeful tick. The stop and target are placed immediately.
Many beginners often stumble at this stage. They enter correctly, then widen the stop when price dips. In this example, the trader doesn't do that. Either the flag works, or it doesn't.
The review after the close
Suppose price reaches the target area, hesitates, and the trade is closed. The journal entry should be short and plain:
- Pair: ETH/GBP
- Setup: Bull flag breakout on 15-minute chart
- Higher-time-frame context: 1-hour uptrend
- Entry reason: Break and hold above flag resistance
- Exit reason: Price reached pre-marked resistance zone
- Mistakes: None, or note any hesitation, poor fill, or emotional drift
That's the full loop. Read the chart. Plan the trade. Define the risk. Execute without improvising. Review the result like a business decision, not a mood.
If you want to build that process properly, The Coin Course is a strong place to learn the basics and then go deeper. It covers trading, wallets, security, market structure, and practical crypto skills in a way that's clear enough for beginners without talking down to them.